
Abstract
AimCellular fibroadenomas (CFAs) and phyllodes tumours (PTs) arise from the breast parenchyma and consist of both epithelial and stromal components. In our study, we aimed to investigate and compare magnetic resonance imaging (MRI) characteristics of these lesions to facilitate the process of differentiation and management.MethodsWe retrospectively analysed the breast MRI data of patients pathologically diagnosed with PT and CFA. 25 patients with preoperative MRI who were diagnosed with PT in the last five years and 25 patients with preoperative MRI who were diagnosed with CFA in the last one year were randomly selected and included in the study. MRI findings were classified according to the Breast Imaging Reporting and Database System (BIRADS). Pearson Chi-Square and Fisher’s Exact tests were used to calculate the statistical difference between MRI features of CFA and PT.ResultsThe mean age was calculated 32.68 ± 7.73 for patients with CFA and 38.32 ± 10.71 for patients with PT (p=0.038). In fat suppressed T2 weighed imaging (WI) both lesion groups showed similar characteristics; 24 of the CFAs and 19 of the PTs demonstrated an increase in signal intensity. Two CFAs and nine PTs had cystic components (p=0.017). Signal increase in the surrounding tissue in fat suppressed T2WI was seen in 11 (44%) of the PTs, but in only 1 (4%) of the CFAs (p=0.001). On delayed phase T1WI, 10 of the CFAs and 18 of the PTs sustained heterogeneous enhancement characteristics (p=0.023).ConclusionAll in all, we found that PTs arise later in life compared to CFAs. Increased signal intensity in the surrounding tissue in fat suppressed T2WI and the presence of a cystic component is more suggestive of PT. In delayed phase T1WI, CFAs appear to be homogenously enhanced, whereas PTs maintain their heterogeneous enhancement.
Keywords
Introduction
Cellular fibroepithelial lesions (CFELs) arise from the breast parenchyma and consist of both epithelial and stromal components. They comprise cellular fibroadenomas (CFAs) and phyllodes tumours (PTs).1 PTs are further classified as benign, borderline and malignant. CFELs are histologically evaluated mainly according to mitotic activity, atypia and stromal cellularity.2
Fibroadenomas are the most common benign lumps of the breast among women of 20–50 years of age. Phyllodes tumours refer to only 1% of all breast tumours and generally arise later in life.3 Differential diagnosis of these tumours is usually made by core needle biopsy (CNB). CFA demonstrates microscopic features similar to benign variants of PT.4-5 However, their clinical behaviour can be very different. Due to high recurrence rates, PTs should be removed with negative surgical margins. If the diagnosis of fibroadenoma is confirmed, there is no need for surgical intervention unless it causes discomfort to the patient or rapid growth is seen on follow-up scans.6
Ultrasound and mammography are not sufficient to distinguish between CFA and PT. Breast Magnetic Resonance Imaging (MRI) is used for Breast Imaging Reporting and Database System (BIRADS) scoring for these lesions. According to the BIRADS score and clinical findings, CNB is performed in order to achieve a definitive pathological diagnosis.7 Nevertheless, in some cases pathological evaluation proves to be less rewarding if there is not enough evidence in the sample to differentiate CFELs. These cases mostly require excisional biopsy for thorough examination.8-9
In our study, we aim to investigate and compare MRI characteristics of cellular fibroadenoma and phyllodes tumour to facilitate the process of differentiation and management of CFELs.
Materials and Methods
This retrospective study was conducted in accordance with the ethical guidelines of the Declaration of Helsinki. We have analysed the breast MRI data of patients with a pathological diagnosis of PT and CFA retrospectively. In the last 5 years, 108 patients diagnosed with PT in our hospital were retrospectively analyzed. All of the patients included in this study, gave their written consent prior to MRI and biopsy procedures. After excluding those who did not have MRI or were not eligible for evaluation, 25 patients with PT were included in the study. Then, 25 patients who were diagnosed with CFA within last one year, had MRI and were eligible for evaluation were randomly selected and included in the study. The diagnosis was confirmed by ultrasound-guided CNB in 14 CFA and 10 PT patients and by excisional biopsy in the remaining 11 and 15 patients.
Images were obtained on 2 devices both of which were 1.5T MRI units. T1 weighted imaging (WI), T2WI, diffusion weighted imaging (DWI) and dynamic sequences were performed. MRI parameters for Achieva; Philips Healthcare were as follows; repetition time (TR) 550 ms, echo time (TE) 8.0 ms, slice thickness 3 mm, field of view (FOV) 300 mm, matrix size 300x240 mm, flip angle 90 and number of excitations (NEX) 2. For Aera; Siemens Healthineers, the MRI parameters were as follows; TR 476 ms, TE 11 ms, slice thickness 4 mm, field of view (FOV) 260 mm, matrix width 300x240 mm, flip angle 180 and NEX 2.
Evaluation of the patients was made by 2 radiologists, one with 8 years of experience and the other with 30 years of experience, and based on the BIRADS criteria. Breast composition and background parenchymal enhancement was noted to estimate the reliability of the obtained MRI for diagnosis. Descriptive features included lesion size, shape, margin, lobulation, T1WI, T2WI and DWI characteristics. T1WI and T2WI characteristics were further assessed in fat suppressed sequences. Lesions were additionally assessed for septation, pseudocapsulation and cystic components. Evaluation of internal enhancement characteristics was made by kinetic curve assessment and delayed phase T1WI. Enhancement of the septations, if present, was also noted.
The diagnoses of CFA and PT were made on core needle biopsy specimens based on histological criteria including stromal mitosis, stromal overgrowth, stromal cellularity, infiltration into surrounding adipose tissue and stromal atypia. Pathological preparations were evaluated by a breast pathologist with 30 years of experience blinded to the original diagnoses on core biopsies and surgical excision specimens.Ethical ApprovalThe study was approved by the Ethics Committee of the University of Health Sciences, Izmir Bozyaka Training and Research Hospital (Date: 11.11.2020, Decision No: 06).Statistical AnalysisAnalysis of the data was performed using SPSS (IBM Corp. Released 2019. IBM SPSS Statistics for Windows, Version 26.0. Armonk, NY: IBM Corp). Age of the patients, size and Apparent Diffusion Coefficient (ADC) values of the lesions were assessed by independent sample t test. Lesion size was based on the largest diameter. Pearson Chi-Square and Fisher’s Exact tests were used to calculate the statistical difference between MRI features of CFA and PT. Results are considered as statistically significant if the p-value is lower than 0.05 in all analyses.Reporting GuidelinesThis study was reported according to the STROBE guidelines.
Results
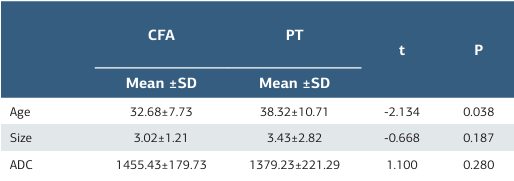
Mean age of the patients, mean size and ADC values of the lesions in our study are shown in Table 1. Mean age was calculated as 32.68 ± 7.73 for 25 patients with CFA and was 38.32 ± 10.71 for 25 patients with PT. Difference between the mean age of CFA and PT groups were statistically significant (p=0.038). PT appeared to be presented later in life compared to CFAs. Based on the maximum diameter of the lesions; 12 (48%) CFAs and 11 (44%) PTs were smaller than 3 cm in size. 13 (52%) CFAs and 11 (44%) PTs were between 3–6 cm. None of the CFA lesions were larger than 6 cm, but 3 (12%) PT lesions exceeded 6 cm. Mean ADC values were calculated as 1455.43 ± 179.73 for 21 CFAs and 1379.23 ± 221.29 for 20 PTs. There were no statistical significance between the mean size (p=0.187) and ADC (p=0.280) values of the groups (Table 1). ADC values of 4 patients with CFA and 5 patients with PT were not included in the study because DWI was not available.
Extreme fibroglandular tissue was seen in 14 (56%) patients with CFA and 13 (52%) patients with PT. Background parenchymal enhancement was marked in 8 (32%) CFA and 2 (8%) PT patients.
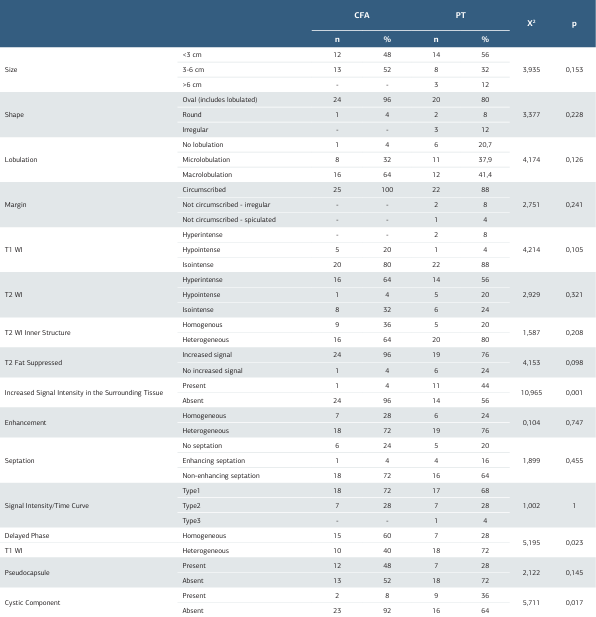
MRI features of CFA and PT groups were shown and compared with statistical analysis in Table 2. 24 (96%) of the CFA lesions were oval (includes lobulated) in shape and the remaining one was round. Among PT lesions, two (8%) were round and three (12%) were irregular in shape and the rest (80%) were oval. Microlobulation was seen in eight (32%) of the CFAs and 11 (44%) of the PTs. All the CFAs had circumscribed margins, whereas two of the PTs had irregular and one of them had spiculated margins (Table 2).
Although both CFAs and PTs mostly appeared as isointense compared to breast parenchyma on T1WI, five (20%) of the CFAs and one (4%) of the PTs were hypointense. T2WI characteristics of the lesions were mostly seen as hyperintense, but one (4%) of the CFAs and five (20%) of the PTs appeared as hypointense. Inner structure of the lesions in T2WI was heterogeneous in 16 (64%) of the CFAs and 21 (84%) of the PTs. In fat-suppressed T2WI both lesion groups showed similar characteristics; 24 (96%) of the CFAs and 19 (76%) of the PTs demonstrated an increase in signal intensity. On the other hand, increased signal in surrounding tissue on fat-suppressed T2WI sequences was seen in 11 (44%) of the PTs, but in only one (4%) of the CFAs. This remarkable difference was proven to be statistically significant (p=0.001, Table 2).
18 (72%) CFAs and 19 (76%) PTs showed heterogeneous enhancement in early sequences after contrast administration. However, on delayed phase T1WI, 10 (40%) of the CFAs and 18 (72%) of the PTs sustained heterogeneous enhancement characteristics. This finding was noted as statistically significant (p=0.023). Signal intensity/time curve demonstrated type one pattern in majority of the cases, 18 (72%) of the CFAs and 17 (68%) of the PTs. Seven (28%) CFAs and seven (28%) PTs had type 2, one (4%) PT had type 3 pattern. Among CFAs, one (4%) had enhancing and 18 (72%) had non-enhancing internal septations, whereas among PTs, four (16%) of them were enhancing and 16 (64%) were non-enhancing. Pseudocapsulation was seen in 12 (48%) of the CFAs and seven (28%) of the PTs. Two (8%) CFAs and nine (36%) PTs had cystic components and this result was also statistically significant (p=0.017, Table 2). MRI examples of CFA and PT are shown in Figure 1 and Figure 2.
BIRADS classification of the PTs were resulted as BIRADS-4A in 14 (56%), BIRADS-4B in 8 (32%) and BIRADS-4C in 3 (12%) of the cases. Obtained pathology results showed that among 25 PTs, 15 (60%) were benign, four (16%) were borderline, two (8%) were malignant and remaining four (16%) were not specified. 21 (84%) CFA lesions were reported as BIRADS-4A. Although remaining four (16%) were categorized as BIRADS-3, they were surgically removed due to causing discomfort to patients.
Discussion
We have assessed the MRI features of 50 patients consisting of 25 CFA and 25 PT. Mean age of the patients with PT was higher than the ones with CFA, which is in line with previous studies.10-11-12 Mean size of the lesions was slightly higher in PT group and this finding is also supported by the literature.10-11,13 In addition, our study showed that the presence of cystic component, heterogeneous enhancement in delayed phase T1WI on dynamic examination and increased signal intensity in the surrounding tissue supported PT.
Older studies in the literature found that phyllodes tumours were predominantly lobulated,14-15 but more recent studies reported that both tumours tended to be oval or lobulated and there was no significant difference in shape between them.13,16-17 In our study, lesion shape was classified according to the American College of Radiology (ACR) BIRADS Atlas, 5th edition and categorised into three groups: oval (including lobulated), round and irregular. Although there was no statistically significant difference, none of the CFAs had an irregular shape, whereas all three lesions with an irregular shape were PT.
Kamitani et al.12 pointed out that PTs show strong (having an acute angle) lobulation more than CFAs. Duman et al.10 obtained statistically significant results with ultrasonography and mammography showing that microlobulation is more frequently seen in PTs. In the present study, although not statistically significant, we have obtained similar results with MRI. Both tumours are described as well circumscribed in the literature. However, in our study, similar to the study of Duman et al.10 all of the CFAs were well circumscribed, while three of the PTs were found to be irregular and spiculated.
We have also assessed the lesions for pseudocapsule formation. It was found to be more common for CFAs, as seen in few other studies,12-13 but no statistically significant difference is achieved so far.
T1 and T2WI characteristics were unrewarding as a means to differentiate CFELs in our study. Most of the CFAs and PTs appeared isointense in T1WI and hyperintense in T2WI compared to breast parenchyma. Kinoshita et al.18 analysed benign PTs and showed T1WI hypointense, T2WI hyper and isointense. According to Wurdinger et al.11 lesions were mostly hypointense in T1 and T2WI. In the study of Tan et al.19 the T2WI signal of all PTs was found to be hyperintense. Balaji et al.20 described a slit-like pattern on MRI of benign PTs. In this pattern, hyperintense slit-like fluid-filled cavities are present in T2WI and do not show significant contrast intensity after enhancement. In our study, the cystic component found in PTs was statistically significantly higher than CFA. Cystic components may represent this pattern.
Wiratkapun et al.9 described the internal structure of PTs as heterogeneous in their ultrasound study, as reported in other sonographic studies.3,10,17,21 We also found that heterogeneous inner structure was slightly more common for PTs on T2WI like literature. The most prominent statistically significant difference between CFA and PT in our study was found when fat-suppressed T2 sequences were evaluated. In accordance with Wurdinger et al.11 increased signal intensity in the surrounding tissue was seen more often in PTs which is assumed to be related to the compression of the small ducts and vessels due to rapid tumour growth, hence resulting in interstitial edema.
Benign breast lesions usually exhibit slowly enhancing (type 1) signal intensity/time curve after contrast administration. 18 CFA and 17 PT in our study showed this type of enhancement which is similar to findings of Duman et al.22 On the other hand, Kamitani et al.12 showed that plateau curve is more commonly seen in these lesions. Kinoshita18 and Buadua23 also showed different kinetic curve patterns in PTs in their study. Yabuuchi et al.24 evaluated the relationship between the time-signal intensity curve pattern and histological grade in PT and there was no correlation.
Non-enhancing septation is more frequently associated with CFAs. However, it was similar to the studies of Kinoshita and Kamitani in our study and was also commonly seen in PTs.12,18 In early post-contrast images, heterogeneous enhancement was found to be common for both lesions. Kamitani et al.12 emphasized that in delayed phase T1WI, PTs tend to stay heterogeneous but could not achieve a statistical significance. Our findings go beyond it and show that CFAs are mostly homogenous (60%), whereas PTs appear heterogeneous (72%) in delayed phase T1WI.
ADC is a marker of stromal hypercellularity and is frequently used in brain and breast tumours.25 Yabuuchi et al.24 showed lower ADC values associated with hypercellularity in intermediate and malignant PTs. In our study, in support of this finding, the mean ADC value of PTs was significantly lower than CFAs, but the difference was not statistically significant. In contrast to our findings, the study by Kamitani et al.12 found that ADC values were lower in CFAs.
Limitations
Primary limitation to our study is its retrospective nature. This made it impossible for us to alter the MRI process. Some of the obtained images were not good enough for evaluation. It resulted in the inclusion of less number of cases to our study. Previous MRI protocols did not contain diffusion weighted imaging. Thus, we could not determine the ADC values of older lesions. When CNBs failed to result in a definitive diagnosis, excisional biopsy was recommended. However, some patients did not show up for further assessment and final pathology result of these lesions remained unclear.
Conclusion
All in all, in our study, we found that PTs arise later in life compared to CFAs. Increased signal intensity in the surrounding tissue in fat suppressed T2WI is more suggestive of PT. In delayed phase T1WI, CFAs appear to be homogenously enhanced, whereas PTs maintain their heterogeneous enhancement. The presence of a cystic component is more commonly seen in PTs than in CFAs. Nevertheless, prospective current studies with a larger number of patients are needed.
Abbreviations
ADC: Apparent diffusion coefficient
BIRADS: Breast imaging reporting and data system
CFA: Cellular fibroadenoma
CFEL: Cellular fibroepithelial lesion
CNB: Core needle biopsy
DWI: Diffusion-weighted imaging
MRI: Magnetic resonance imaging
PT: Phyllodes tumour
T1WI: T1-weighted imaging
T2WI: T2-weighted imaging
References
- Yasir S, Gamez R, Jenkins S, Visscher DW, Nassar A. Significant histologic features differentiating cellular fibroadenoma from phyllodes tumor on core needle biopsy specimens. Am J Clin Pathol. 2014;142(3):362-369. doi:10.1309/ajcpzuz96resgpup
- Yasir S, Nassar A, Jimenez RE, et al. Cellular fibroepithelial lesions of the breast: a long-term follow-up study. Ann Diagn Pathol. 2018;35:85-91. doi:10.1016/j.anndiagpath.2018.01.005
- Gatta G, Iaselli F, Parlato V, Di Grezia G, Grassi R, Rotondo A. Differential diagnosis between fibroadenoma, giant fibroadenoma and phyllodes tumour: sonographic features and core needle biopsy. Radiol Med. 2011;116(6):905-918. doi:10.1007/s11547-011-0672-y
- Jung J, Kang E, Chae SM, et al. Development of a management algorithm for the diagnosis of cellular fibroepithelial lesions from core needle biopsies. Int J Surg Pathol. 2018;26(8):684-692. doi:10.1177/1066896918775525
- Tan PH. Fibroepithelial lesions revisited: implications for diagnosis and management. Mod Pathol. 2021;34(suppl 1):15-37. doi:10.1038/s41379-020-0583-3
- Al-Arnawoot B, Scaranelo A, Fleming R, et al. Cellular fibroepithelial lesions diagnosed on core needle biopsy: is there any role of clinical-sonography features helping to differentiate fibroadenomas and phyllodes tumor? J Surg Oncol. 2020;122(3):382-387.
- McCarthy E, Kavanagh J, O’Donoghue Y, McCormack E, D’Arcy C, O’Keeffe SA. Phyllodes tumours of the breast: radiological presentation, management and follow-up. Br J Radiol. 2014;87(1044):20140239. doi:10.1259/bjr.20140239
- Resetkova E, Khazai L, Albarracin CT, Arribas E. Clinical and radiologic data and core needle biopsy findings should dictate management of cellular fibroepithelial tumors of the breast. Breast J. 2010;16(6):573-580. doi:10.1111/j.1524-4741.2010.01013.x
- Wiratkapun C, Piyapan P, Lertsithichai P, Larbcharoensub N. Fibroadenoma versus phyllodes tumor: distinguishing factors in patients diagnosed with fibroepithelial lesions after a core needle biopsy. Diagn Interv Radiol. 2014;20(1):27-33. doi:10.5152/dir.2013.13133
- Duman L, Gezer NS, Balcı P, et al. Differentiation between phyllodes tumors and fibroadenomas based on mammographic, sonographic and MRI features. Breast Care (Basel). 2016;11(2):123-127. doi:10.1159/000444377
- Wurdinger S, Herzog AB, Fischer DR, et al. Differentiation of phyllodes breast tumors from fibroadenomas on MRI. AJR Am J Roentgenol. 2005;185(5):1317-1321. doi:10.2214/ajr.04.1620
- Kamitani T, Matsuo Y, Yabuuchi H, et al. Differentiation between benign phyllodes tumors and fibroadenomas of the breast on MR imaging. Eur J Radiol. 2014;83(8):1344-1349. doi:10.1016/j.ejrad.2014.04.031
- Yilmaz E, Sal S, Lebe B. Differentiation of phyllodes tumors versus fibroadenomas: mammographic and sonographic features. Acta Radiol. 2002;43(1):34-39. doi:10.1080/028418502127347619
- Buchberger W, Strasser K, Heim K, Müller E, Schröcksnadel H. Phylloides tumor: findings on mammography, sonography, and aspiration cytology in 10 cases. AJR Am J Roentgenol. 1991;157(4):715-719. doi:10.2214/ajr.157.4.1654022
- Jorge Blanco A, Vargas Serrano B, Rodríguez Romero R, Martínez Cendejas E. Phyllodes tumors of the breast. Eur Radiol. 1999;9(2):356-360. doi:10.1007/s003300050680
- Jacklin RK, Ridgway PF, Ziprin P, Healy V, Hadjiminas D, Darzi A. Optimising preoperative diagnosis in phyllodes tumour of the breast. J Clin Pathol. 2006;59(5):454-459. doi:10.1136/jcp.2005.025866
- Bode MK, Rissanen T, Apaja-Sarkkinen M. Ultrasonography and core needle biopsy in the differential diagnosis of fibroadenoma and tumor phyllodes. Acta Radiol. 2007;48(7):708-713. doi:10.1080/02841850701367911
- Kinoshita T, Fukutomi T, Kubochi K. Magnetic resonance imaging of benign phyllodes tumors of the breast. Breast J. 2004;10(3):232-236. doi:10.1111/j.1075-122x.2004.21316.x
- Tan H, Zhang S, Liu H, et al. Imaging findings in phyllodes tumors of the breast. Eur J Radiol. 2012;81(1). doi:10.1016/j.ejrad.2011.01.085
- Balaji R, Ramachandran KN. Magnetic resonance imaging of a benign phyllodes tumor of the breast. Breast Care (Basel). 2009;4(3):189-191. doi:10.1159/000220604
- Foxcroft LM, Evans EB, Porter AJ. Difficulties in the preoperative diagnosis of phyllodes tumours of the breast: a study of 84 cases. Breast. 2007;16(1):27-37. doi:10.1016/j.breast.2006.05.004
- Komenaka IK, El-Tamer M, Pile-Spellman E, Hibshoosh H. Core needle biopsy as a diagnostic tool to differentiate phyllodes tumor from fibroadenoma. Arch Surg. 2003;138(9):987-990. doi:10.1001/archsurg.138.9.987
- Buadu LD, Murakami J, Murayama S, et al. Breast lesions: correlation of contrast medium enhancement patterns on MR images with histopathologic findings and tumor angiogenesis. Radiology. 1996;200(3):639-649. doi:10.1148/radiology.200.3.8756909
- Yabuuchi H, Soeda H, Matsuo Y, et al. Phyllodes tumor of the breast: correlation between MR findings and histologic grade. Radiology. 2006;241(3):702-709. doi:10.1148/radiol.2413051470
- Guo Y, Cai YQ, Cai ZL, et al. Differentiation of clinically benign and malignant breast lesions using diffusion-weighted imaging. J Magn Reson Imaging. 2002;16(2):172-178. doi:10.1002/jmri.10140
Tables
Table 1. Mean age, size and ADC values for each group
ADC: Apparent Diffusion Coefficient, CFA: Cellular Fibroadenoma, PT: Phylloid Tumour, SD: Standard Deviation.
Table 2. ADC: Apparent Diffusion Coefficient, CFA: Cellular Fibroadenoma, PT: Phylloid Tumour, SD: Standard Deviation
MRI: Magnetic Resonance Imaging, CFA: Cellular Fibroadenoma, PT: Phylloid Tumour.
Figures
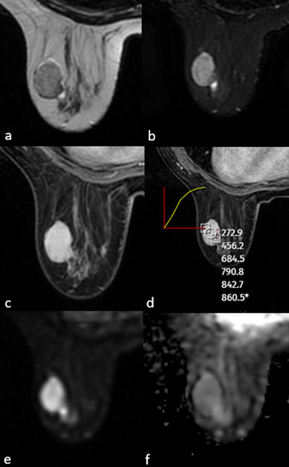
Figure 1. MRI of a 28-year-old female patient showed a well-circumscribed solid mass with no contour lobulation, hypointense on T1WI (a), heterogeneously hyperintense on T2A (b), homogeneous internal structure, homogeneous contrast enhancement on postcontrast T1WI (c), type 1 signal intensity/time curve (d) and no significant diffusion restriction on DWI (e,f). After excision, the pathological diagnosis was fibroadenoma
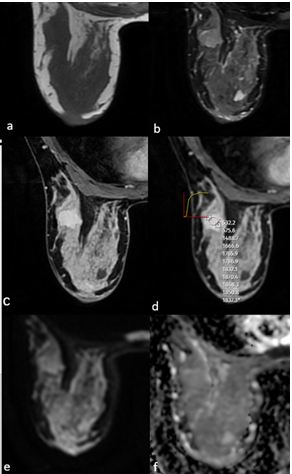
Figure 2. MRI of a 43-year-old female patient showed a well-circumscribed solid mass with microlobulated contour, isointense on T1WI (a), heterogeneous hyperintense on T2A (b), homogeneous contrast enhancement on postcontrast T1WI (c), type 2 signal intensity/time curve (d), and no significant diffusion restriction on DWI (e,f). After excision, the pathological diagnosis was borderline phyllodes tumour
Additional Information
Publisher’s Note
Bayrakol MP remains neutral with regard to jurisdictional and institutional claims.
Rights and Permissions
This work is licensed under a Creative Commons Attribution-NonCommercial 4.0 International License (CC BY-NC 4.0). To view a copy of the license, visit https://creativecommons.org/licenses/by-nc/4.0/
About This Article
How to Cite This Article
Hülya Çetin Tunçez, Başak Ünverdi, Zehra Hilal Adıbelli, Baha Zengel, Funda Taşlı. Is there an MRI characteristic feature that distinguishes a phyllodes tumor from a fibroadenoma?. doi:10.4328/ACAM.22629
Publication History
- Received:
- 04.03.2025
- Accepted:
- 12.05.2025
- Published Online:
- 21.05.2025
- Printed:
- 01.12.2025