
Abstract
AimOsteoarthritis (OA) and osteoporosis (OP) are two metabolic bone diseases associated with old age. Recently, the hypothesis that there may be a relationship between OP and OA and that the degree of OA will change with the degree of OP has been emphasized. In this cross-sectional study, the relationship between knee OA and bone mineral density (BMD) in female patients was investigated.MethodsIn this cross-sectional study of 324 patients with knee pain and radiological diagnosis of knee OA, the severity of knee OA was evaluated according to Kellgren-Lawrence (K-L) radiographic criteria and joint space distance (JSD). BMD of the femur and lumbar spine was measured by dual-energy X-ray absorptiometry (DXA). K-L grade and the relationship between JSD and BMD were examined.ResultsT scores of femoral neck, femoral trochanter, femoral intertrochanter, total hip were highest in K-L stage 2 group and lowest in K-L stage 4 group. Femoral T scores were found to be significantly lower in BMD in the C-L stage 3 and 4 group compared to the C-L stage 1 and 2 group (P < .001). No significant correlation was found between K-L stage and L1-L4 T score. ConclusionAlthough there is an inverse relationship between OP and the presence of knee OA, the relationship between the two is not linear. In order to evaluate patients better, it is necessary to know the relationship between the two diseases.
Keywords
Introduction
Osteoarthritis (OA) and osteoporosis (OP) are two metabolic diseases that increase in frequency with age, are very common in society, negatively affect the patient’s quality of life, and cause functional disability. Osteoporosis is a skeletal disease characterized by decreased bone mineral density (BMD), causing deterioration in bone microarchitecture and reduction in bone mass.1 Osteoarthritis, on the other hand, is a degenerative skeletal disease that can affect all joints, characterized by the deterioration of articular cartilage and new bone formation.2,3 The relationship between these two diseases is quite complex in terms of bone loss, new bone formation, fracture risk, mechanical loading, and systemic causes. Although recent publications are trying to explain the relationship between the two, this relationship has not been clearly demonstrated and is still controversial.4,5 Bone turnover plays a very important role in the common pathophysiology of OA and OP. It has been reported that there is a relationship between high bone turnover and the progression of OA levels in osteoporosis. In some studies, it has been found that patients with severe knee OA have higher bone turnover biomarkers and lower bone mineral density.6
In rabbit experiments to explain the relationship between OP and OA, it has been emphasized that the deterioration in the microarchitecture of the subchondral bone caused by osteoporosis increases the severity of osteoarthritis. There are cross-sectional and experimental studies examining the relationship between BMD and knee OA over the Kellgren-Lawrence (K-L) grade. In a study on women, BMD scores were found to be higher in the K-L grade 2 and above group compared to the group without OA.5,7 In some studies, it has been shown that high BMD is protective in terms of OA severity.8,9
In this study, it was aimed to examine the relationship between radiological knee OA severity and ipsilateral proximal femur and L1-L4 lumbar spine T-score in postmenopausal women.
Materials and Methods
This cross-sectional study included 324 postmenopausal women patients who applied to the Physical Medicine and Rehabilitation outpatient clinic with knee pain between January 2020 and January 2021 and were diagnosed with knee OA according to American College of Rheumatology (ACR) criteria.10
Demographic data such as age and BMI (kg/m²) were recorded. Radiologic staging of knee OA by Kellgren-Lawrence (K-L) and BMD measurement by dual-energy X-ray absorptiometry (DXA)11 were done for each patient.12 Femoral neck, trochanteric femur, intertrochanteric femur, total hip, and L1-L4 lumbar spine total T-scores of all participating patients were measured by DXA. The severity of knee OA was evaluated according to K-L radiographic criteria and joint space distance (JSD). JSD was measured by anteroposterior (AP) knee radiography. K-L grade and the relationship between JSD and BMD were investigated.
Inclusion criteria were ages between 50-75 postmenopausal women and OA staging of K-L between 1 to 4. Exclusion criteria: K-L grade 0, history of surgical procedure related to the knee, valgus alignment (≥3° valgus), inflammatory joint disease, congenital knee joint deformity, endocrinological disease, and diseases affecting bone metabolism. Diagnoses of lumbar spondylosis and coxarthrosis, which may affect DXA measurement results, were excluded.Assessment of Radiographic Knee OARadiologic evaluation of osteoarthritis was performed according to K-L staging. K-L staging: anteroposterior and lateral radiographs of both knees taken while standing were evaluated (at 30° flexion). Knee OA staging was classified radiographically by a physiatrist according to the K-L criteria:
- Stage 0: Normal
- Stage I: Suspected osteophytes, normal joint spacing
- Stage 2: Definite osteophyte, suspicious narrowing of joint space
- Stage 3: Moderately numerous osteophytes, definite narrowing of joint space, mild sclerosis
- Stage 4: Large osteophytes, significant sclerosis and cysts, severe joint space narrowing, definite deformity of the bone ends.13Measurement of Joint Space DistanceKnee joint spacing was measured as recommended in the literature. Patients were asked to slightly bend their knees at 30° flexion, with their weight evenly distributed on both knees. The patella was positioned at the lower end of the femur. The beam was standardized 2.5 cm below the apex of the patella. The mechanical axis of the knee was recorded as the line formed between the center of the femoral head, the medial plateau of the tibia, and the ankle joint. The X-ray was applied parallel to the tibial plateau. JSD was measured as the maximum height in the middle of the medial and lateral compartments of each knee, i.e., the gap in the radiolucent area between the radiopaque edges of the tibiofemoral joint surfaces (Figure 1).14BMD MeasurementDXA measurements were done by Hologic Horizon Wi S/N 201290 at the education and research hospital radiology unit. T-scores below -2.5 for lumbar total, femoral neck, femoral total, and femoral intertrochanteric BMDs were accepted as OP according to World Health Organization (WHO) classification criteria. The BMD value of discrete/crushed vertebrae corpus was subtracted from the value of total lumbar BMD to avoid misinterpretation. According to WHO classification, T-scores between -1 and -2.5 were considered osteopenia, and those below -2.5 were considered OP.11Ethical ApprovalThis study was approved by the Ethics Committee of Harran University, Faculty of Medicine (Date: 15.11.2023, Decision No: HRU/21.20.12).Statistical AnalysisSPSS 20 program was used for statistical analysis, and P < .05 was considered statistically significant. Correlation analysis was performed to analyze the relationship between JSD and T-scores (femoral neck, femoral trochanter, femoral intertrochanter, total hip, and spine) in knee AP images. Analysis of Covariance (ANCOVA) was used to evaluate the relationship between T-scores in K-L stage category groups.
Reporting GuidelinesThis study was reported in accordance with the STROBE guideline.
Results
The mean age of 342 postmenopausal women patients participating in the study was 66.47 ± 8.10 (50–73) years, and the mean BMI was 28.07 ± 3.04 (20.49–39.43) kg/m². The mean value of the JSD was measured as 2.05 ± 1.65 (0–7.40) mm. According to K-L stage, 52 (15.20%) of the patients were K-L stage 1, 38 (11.11%) K-L stage 2, 89 (26.02%) K-L stage 3, and 163 (47.66%) K-L stage 4. Demographic and clinical data of the patients are given in Table 1.
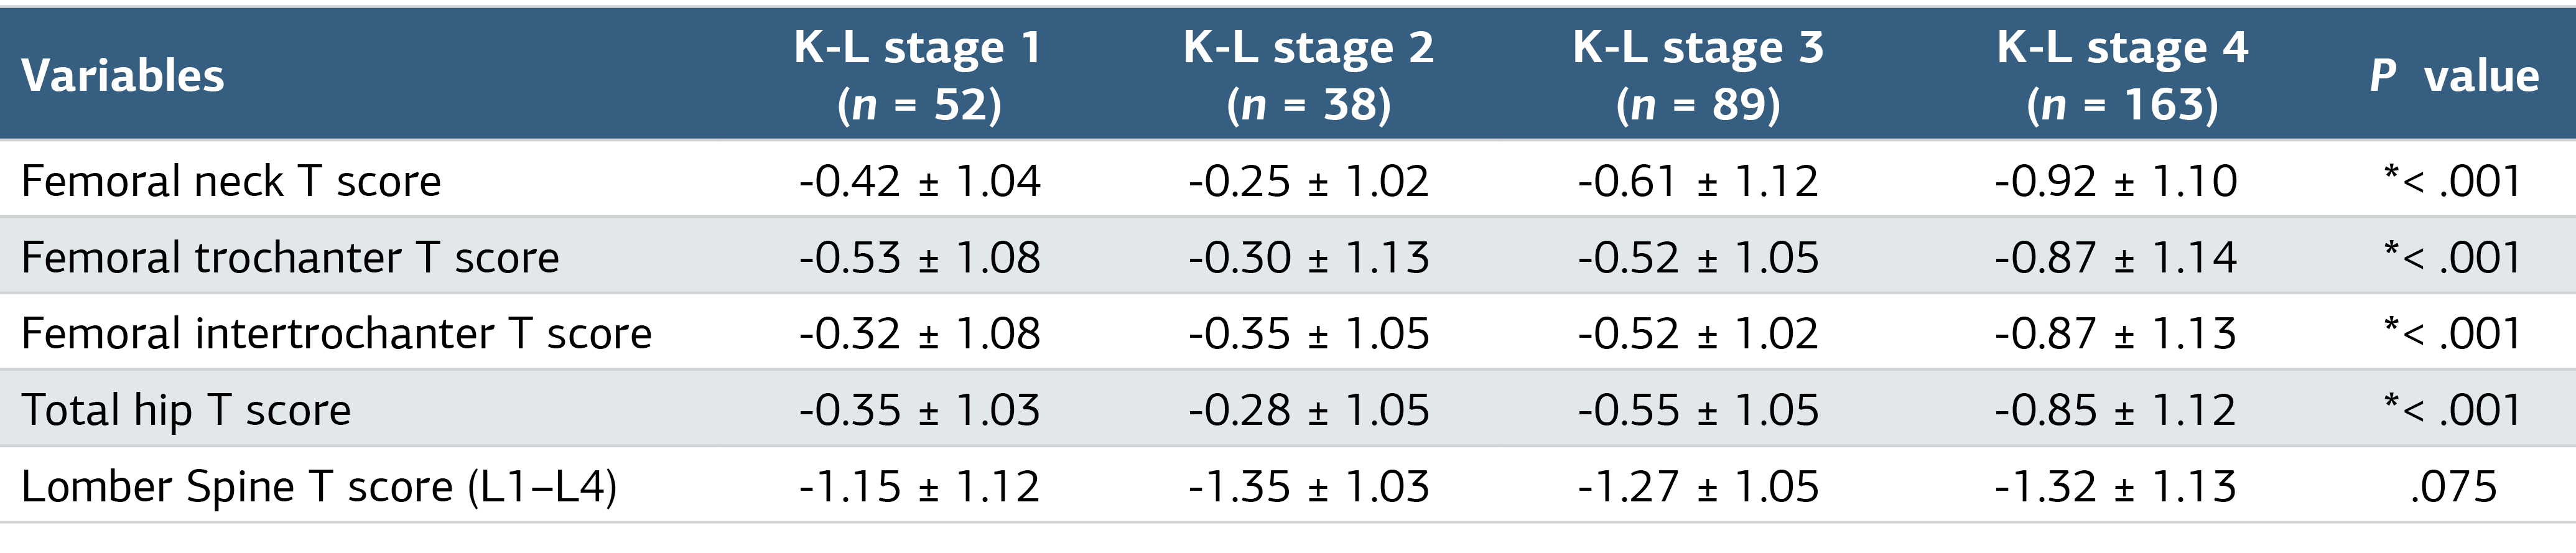
A significant correlation was found between JSD and T-scores of the femoral neck, femoral trochanter, femoral intertrochanter, and total hip (P = .042, r = 0.152; P < .001, r = 0.262; P < .001, r = 0.305; P = .001, r = 0.230, respectively). However, no relationship was found between JSD and spinal L1-L4 T-scores (P = .181, r = 0.105) (Table 2). T-scores of femoral neck, femoral trochanter, femoral intertrochanter, and total hip were highest in the K-L stage 2 group and lowest in the K-L stage 4 group. Femoral T-scores were found to be significantly lower in BMD in the K-L stage 3 and 4 groups compared to the K-L stage 1 and 2 groups (P < .001). No significant correlation was found between K-L stage and spinal L1-L4 T-score (Table 3).
Discussion
The relationship between OA and OP has not been clearly explained.11,15 Due to the factors affecting the pathophysiology of OA and OP, the extent of the relationship between the severity of OP and the degree of OA needs to be addressed from different perspectives. It is not a correct approach to evaluate and treat OA and OP diagnoses separately in clinical practice. It would be an appropriate approach to evaluate and treat both diagnoses together. We think that this study is important in terms of raising awareness on this issue.
In this cross-sectional study, there was a relationship between JSD and K-L staging and hip BMD; however, there was no correlation between spinal BMD. At the same time, it was observed that there was no linear relationship between knee OA and BMD. That is, while the hip T-score was highest in patients with K-L stage 2, it was found to be the lowest in stage 4 patients. The results of this study show some similarities and differences with previous studies.
In the Framingham study, it was found that the femoral BMD value was higher in the female patient group with knee OA compared to the group without OA. However, unlike our study, it was shown that there was no relationship between BMD and JSD.16 There is also a study showing a negative relationship between OP density and K-L staging of OA.4
In a study similar to ours, BMD was found to be higher in K-L stage 2 and lower in K-L stage 3 compared to K-L stage 0 in women. In the study, higher BMD levels were observed with increasing K-L stage.17 In a study of 473 geriatric women, patients with K-L grades 1 and 2 had a higher BMD than those without OA; lower BMD was found in K-L grades 3 and 4.9
In a multicenter OA study, higher BMD was observed in knees without OA and was associated with increases in the degree of joint space narrowing. However, the relationship between OA progression and BMD in knees with OA was not found to be significant.18 Contrary to all these studies, in the study conducted by Sezer et al., no statistically significant relationship was found between BMD and the degree of knee OA.19
Similarly, in a large-scale study conducted in the Korean population, the relationship between BMD and knee OA was investigated. Consistent with our study, in knee OA (K-L grades 2, 3, and 4), femoral neck and total hip BMD decreased as K-L grade increased, while spinal BMD did not differ significantly.20
In a study investigating the relationship between BMD and OA in postmenopausal female patients, lumbar spine BMD levels were statistically higher in the non-OA group than in the OA group. However, there was no difference between the groups in terms of femoral BMD values. As a result, it has been emphasized that OA may be protective against OP.21
Various contributing factors such as metabolic, mechanical, genetic, or endocrinological in the etiology of OA and OP reveal the complex relationship between these two diseases. It has been argued that subchondral bone density may cause progressive chondrocyte dysfunction in the early stages of cartilage destruction. Increased mechanical stress of weight-bearing cartilages with high BMD is aggravating for OA.22
The results of this article make a clinical contribution to the literature. First of all, this is the first study in the literature to evaluate knee OA patients with both K-L stage and JSD and to examine the relationship between both and BMD.
At the same time, the higher T-score in patients with mild OA in the study suggests that bone quality may be misinterpreted in this group. In OA patients, it is also a situation that we should pay attention to when treating OP; it would not be very accurate to evaluate a high T-score as an indicator of good bone quality. It can be interpreted as a temporary increase in the T-score due to the high amount of subchondral bone. It is important to inform patients that OP is more likely to exacerbate, as the T-score decreases significantly with the progression of OA in patients with OA.
It was concluded from this study that OP should be more effectively prevented and treated in patients with early-stage OA. In mild OA, BMD results may not accurately reflect bone quality, as the T-score may increase as a result of bone sclerosis. We think that a different measurement tool should be used to more accurately measure bone quality in clinical practice and more research is needed in this area.
The spine and hip, designated as standard BMD measurement sites, are affected by the subchondral bone in the knee joint, which is a load-bearing joint. Therefore, we think that knee BMD can also be deduced from hip and spine values. More patient and multicenter studies are needed on this subject. We wanted to emphasize the importance of evaluating patients with OA or OP holistically, predicting the risk of OA or OP in patients, and providing appropriate clinical treatment to prevent them in daily practice.
Limitations
This study has some limitations. First of all, the number of patients participating in the study is not sufficient. Second, comorbidities affecting BMD scores were ignored. Third, only patients with radiological OA were included in the study. Its relationship to patients with symptomatic knee pain has not been evaluated.
Conclusion
As a result, this study is an attempt to explain the relationship between OA and OP in more detail. While BMD scores were higher in mild knee OA cases, they were significantly lower in moderate and severe OA. We also hypothesized that it would be possible to deduce the bone quality of the knee from hip and spine BMD, which are the standard regions routinely used for BMD measurement. Because the hip and spine are also stimulated by load bearing similar to the subchondral bone of the knee.
Declarations
Animal and Human Rights Statement
All procedures performed in this study were in accordance with the ethical standards of the institutional and/or national research committee and with the 1964 Helsinki Declaration and its later amendments or comparable ethical standards.
Data Availability
The datasets used and/or analyzed during the current study are not publicly available due to patient privacy reasons but are available from the corresponding author on reasonable request.
Conflict of Interest
The authors declare that there is no conflict of interest.
Funding
None.
Abbreviations
ACR: American college of rheumatology
ANCOVA: Analysis of covariance
AP: Anteroposterior
BMD: Bone mineral density
BMI: Body mass index
DXA: Dual-energy X-ray absorptiometry
JSD: Joint space distance
K-L: Kellgren-Lawrence
OA: Osteoarthritis
OP: Osteoporosis
WHO: World health organization
References
- Zhu Z, Zhang T, Shen Y, Shan PF. The burden of fracture in China from 1990 to 2019. Arch Osteoporos. 2023;19(1):1. doi:10.1007/s11657-023-01353-4
- Man GS, Mologhianu G. Osteoarthritis pathogenesis: a complex process that involves the entire joint. J Med Life. 2014;7:37-41.
- Apold H, Meyer HE, Nordsletten L, et al. Risk factors for knee replacement due to primary osteoarthritis: a population-based, prospective cohort study of 315495 individuals. BMC Musculoskelet Disord. 2014;15:217. doi:10.1186/1471-2474-15-217
- Özövez GA, Alp A. Correlation of femoral cartilage thickness and osteoporosis in patients with knee osteoarthritis. 2021;27(2):96-102.
- Akamatsu Y, Mitsugi N, Taki N, Takeuchi R, Saito T. Relationship between low bone mineral density and varus deformity in postmenopausal women with knee osteoarthritis. J Rheumatol. 2009;36(3):592-597. doi:10.3899/jrheum.080699
- Bellido M, Lugo L, Roman-Blas JA, et al. Subchondral bone microstructural damage by increased remodelling aggravates experimental osteoarthritis preceded by osteoporosis. Arthritis Res Ther. 2010;12(4):152. doi:10.1186/ar3103
- Choi ES, Shin HD, Sim JA, et al. Relationship of bone mineral density and knee osteoarthritis, Kellgren-Lawrence grade: Fifth Korea National Health and Nutrition Examination Survey. Clin Orthop Surg. 2021;13(1):60-66. doi:10.4055/cios20111
- Im GI, Kwon OJ, Kim CH. The relationship between osteoarthritis of the knee and bone mineral density of proximal femur: a cross-sectional study from a Korean population in women. Clin Orthop Surg. 2014;6(4):420-425. doi:10.4055/cios.2014.6.4.420
- Zhang Y, Hannan MT, Chaisson CE, et al. Bone mineral density and risk of incident and progressive radiographic knee osteoarthritis in women: the Framingham Study. J Rheumatol. 2000;27:1032-1037.
- Altman R, Asch E, Bloch D, et al. Development of criteria for the classification and reporting of osteoarthritis: classification of osteoarthritis of the knee. Arthritis Rheum. 1986;29:1039-1049. doi:10.1002/art.1780290816
- Ganguly P, El-Jawhari JJ, Giannoudis PV, Burska AN, Ponchel F, Jones EA. Age-related changes in bone marrow mesenchymal stromal cells: a potential impact on osteoporosis and osteoarthritis development. Cell Transplant. 2017;26(9):1520-1529. doi:10.1177/0963689717721201
- Messina C, Sconfienza LM, Bandirali M, Guglielmi G, Ulivieri FM. Adult dual-energy X-ray absorptiometry in clinical practice: how I report it. Semin Musculoskelet Radiol. 2016;20(3):246-253. doi:10.1055/s-0036-1592370
- Kellgren JH, Lawrence JS. Radiological assessment of osteo-arthrosis. Ann Rheum Dis. 1957;16:494-502. doi:10.1136/ard.16.4.494
- Anas I, Musa TA, Kabiru I, et al. Digital radiographic measurement of normal knee joint space in adults at Kano, Nigeria. Egypt J Radiol Nucl Med. 2013;44(2):253-258. doi:10.1016/j.ejrnm.2013.03.005
- Geusens PP, van den Bergh JP. Osteoporosis and osteoarthritis: shared mechanisms and epidemiology. Curr Opin Rheumatol. 2016;28(2):97-103. doi:10.1097/bor.0000000000000256
- Alkhatatba M, Abualadas J, Tabar MAA, et al. Is there a role for ordering a DEXA scan for patients with symptomatic advanced knee osteoarthritis? Acta Inform Med. 2023;31(2):111-114. doi:10.5455/aim.2023.31.111-114
- Zamzam M, Alamri MS, Aldarsouni FG, Al Zaid H, Al Ofair AA. Impact of osteoporosis in postmenopausal women with primary knee osteoarthritis. Cureus. 2023;15(6). doi:10.7759/cureus.40645
- Nevitt MC, Zhang Y, Javaid MK, et al. High systemic bone mineral density increases the risk of incident knee osteoarthritis and joint space narrowing, but not radiographic progression of existing knee osteoarthritis: the MOST study. Ann Rheum Dis. 2010;69(1):163-168. doi:10.1136/ard.2008.099531
- Sezer I, Illeez OG, Tuna SD, Balci N. The relationship between knee osteoarthritis and osteoporosis. Eurasian J Med. 2010;42(3):124-127. doi:10.5152/eajm.2010.35
- Kim YH, Lee JS, Park JH. Association between bone mineral density and knee osteoarthritis in Koreans: the Fourth and Fifth Korea National Health and Nutrition Examination Surveys. Osteoarthritis Cartilage. 2018;26(11):1511-1517. doi:10.1016/j.joca.2018.07.008
- Lin L, Luo P, Yang M, Wang J, Hou W, Xu P. Causal relationship between osteoporosis and osteoarthritis: a two-sample Mendelian randomized study. Front Endocrinol (Lausanne). 2022;13:1011246. doi:10.3389/fendo.2022.1011246
- Xu J, Wang WZ, Fan X, Wang L, Zhang M. Correlation between osteoarthritis and osteoporosis in men. Sichuan Da Xue Xue Bao Yi Xue Ban. 2023;54(2):439-443.
Tables
Table 1. Demographic Characteristics of the Participants (N = 342)
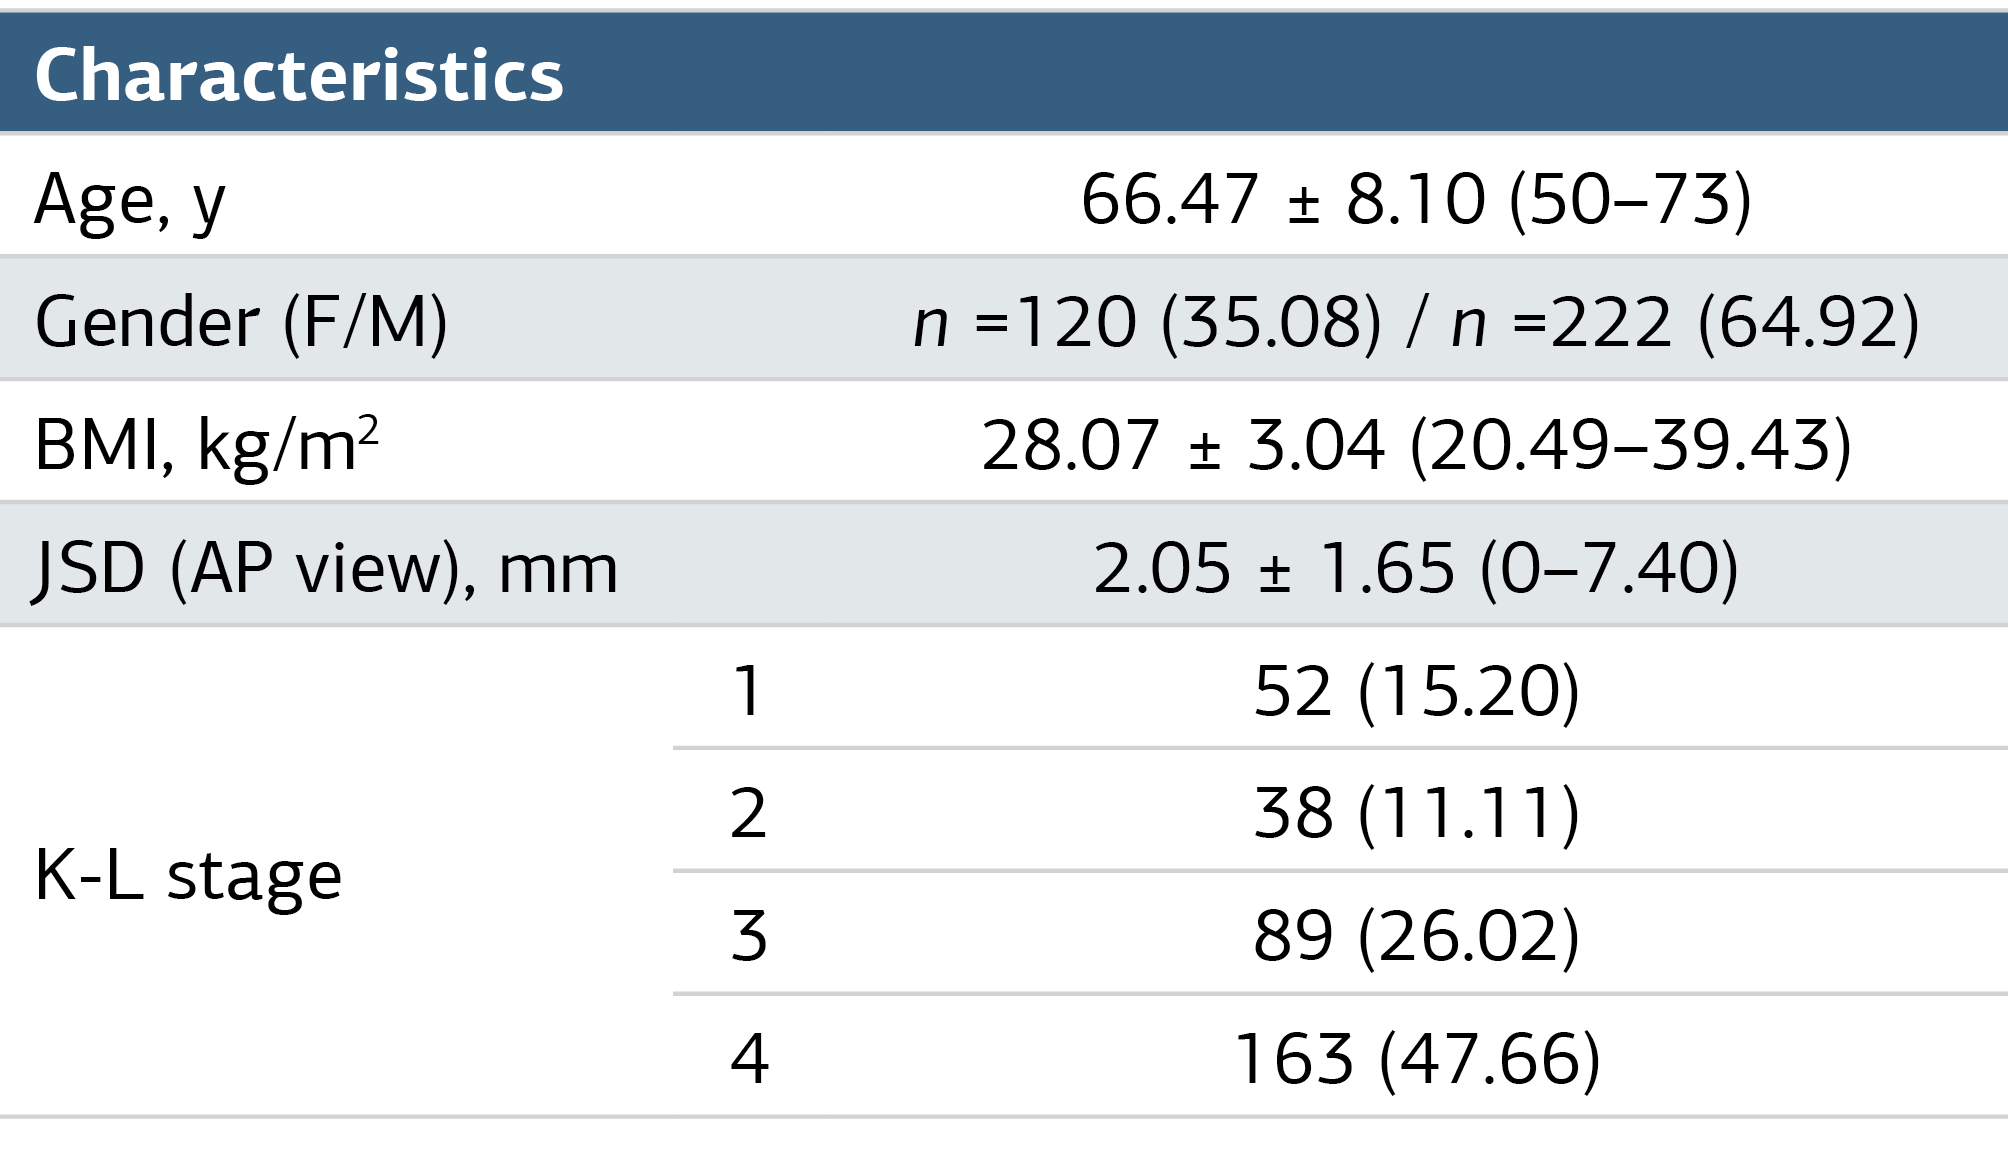
BMI, Body Mass Index; JSD, Joint Space Distance; K-L, Kellgren-Lawrence; AP, Antero Posterior
Table 2. The Relationship Between BMD and JSD

BMD, Bone Mineral Density; AP, Anteroposterior; JSD, Joint Space Distance *P < .05
Table 3. The Relationship Between Tscores and Knee OA (K-L stage)
Figures
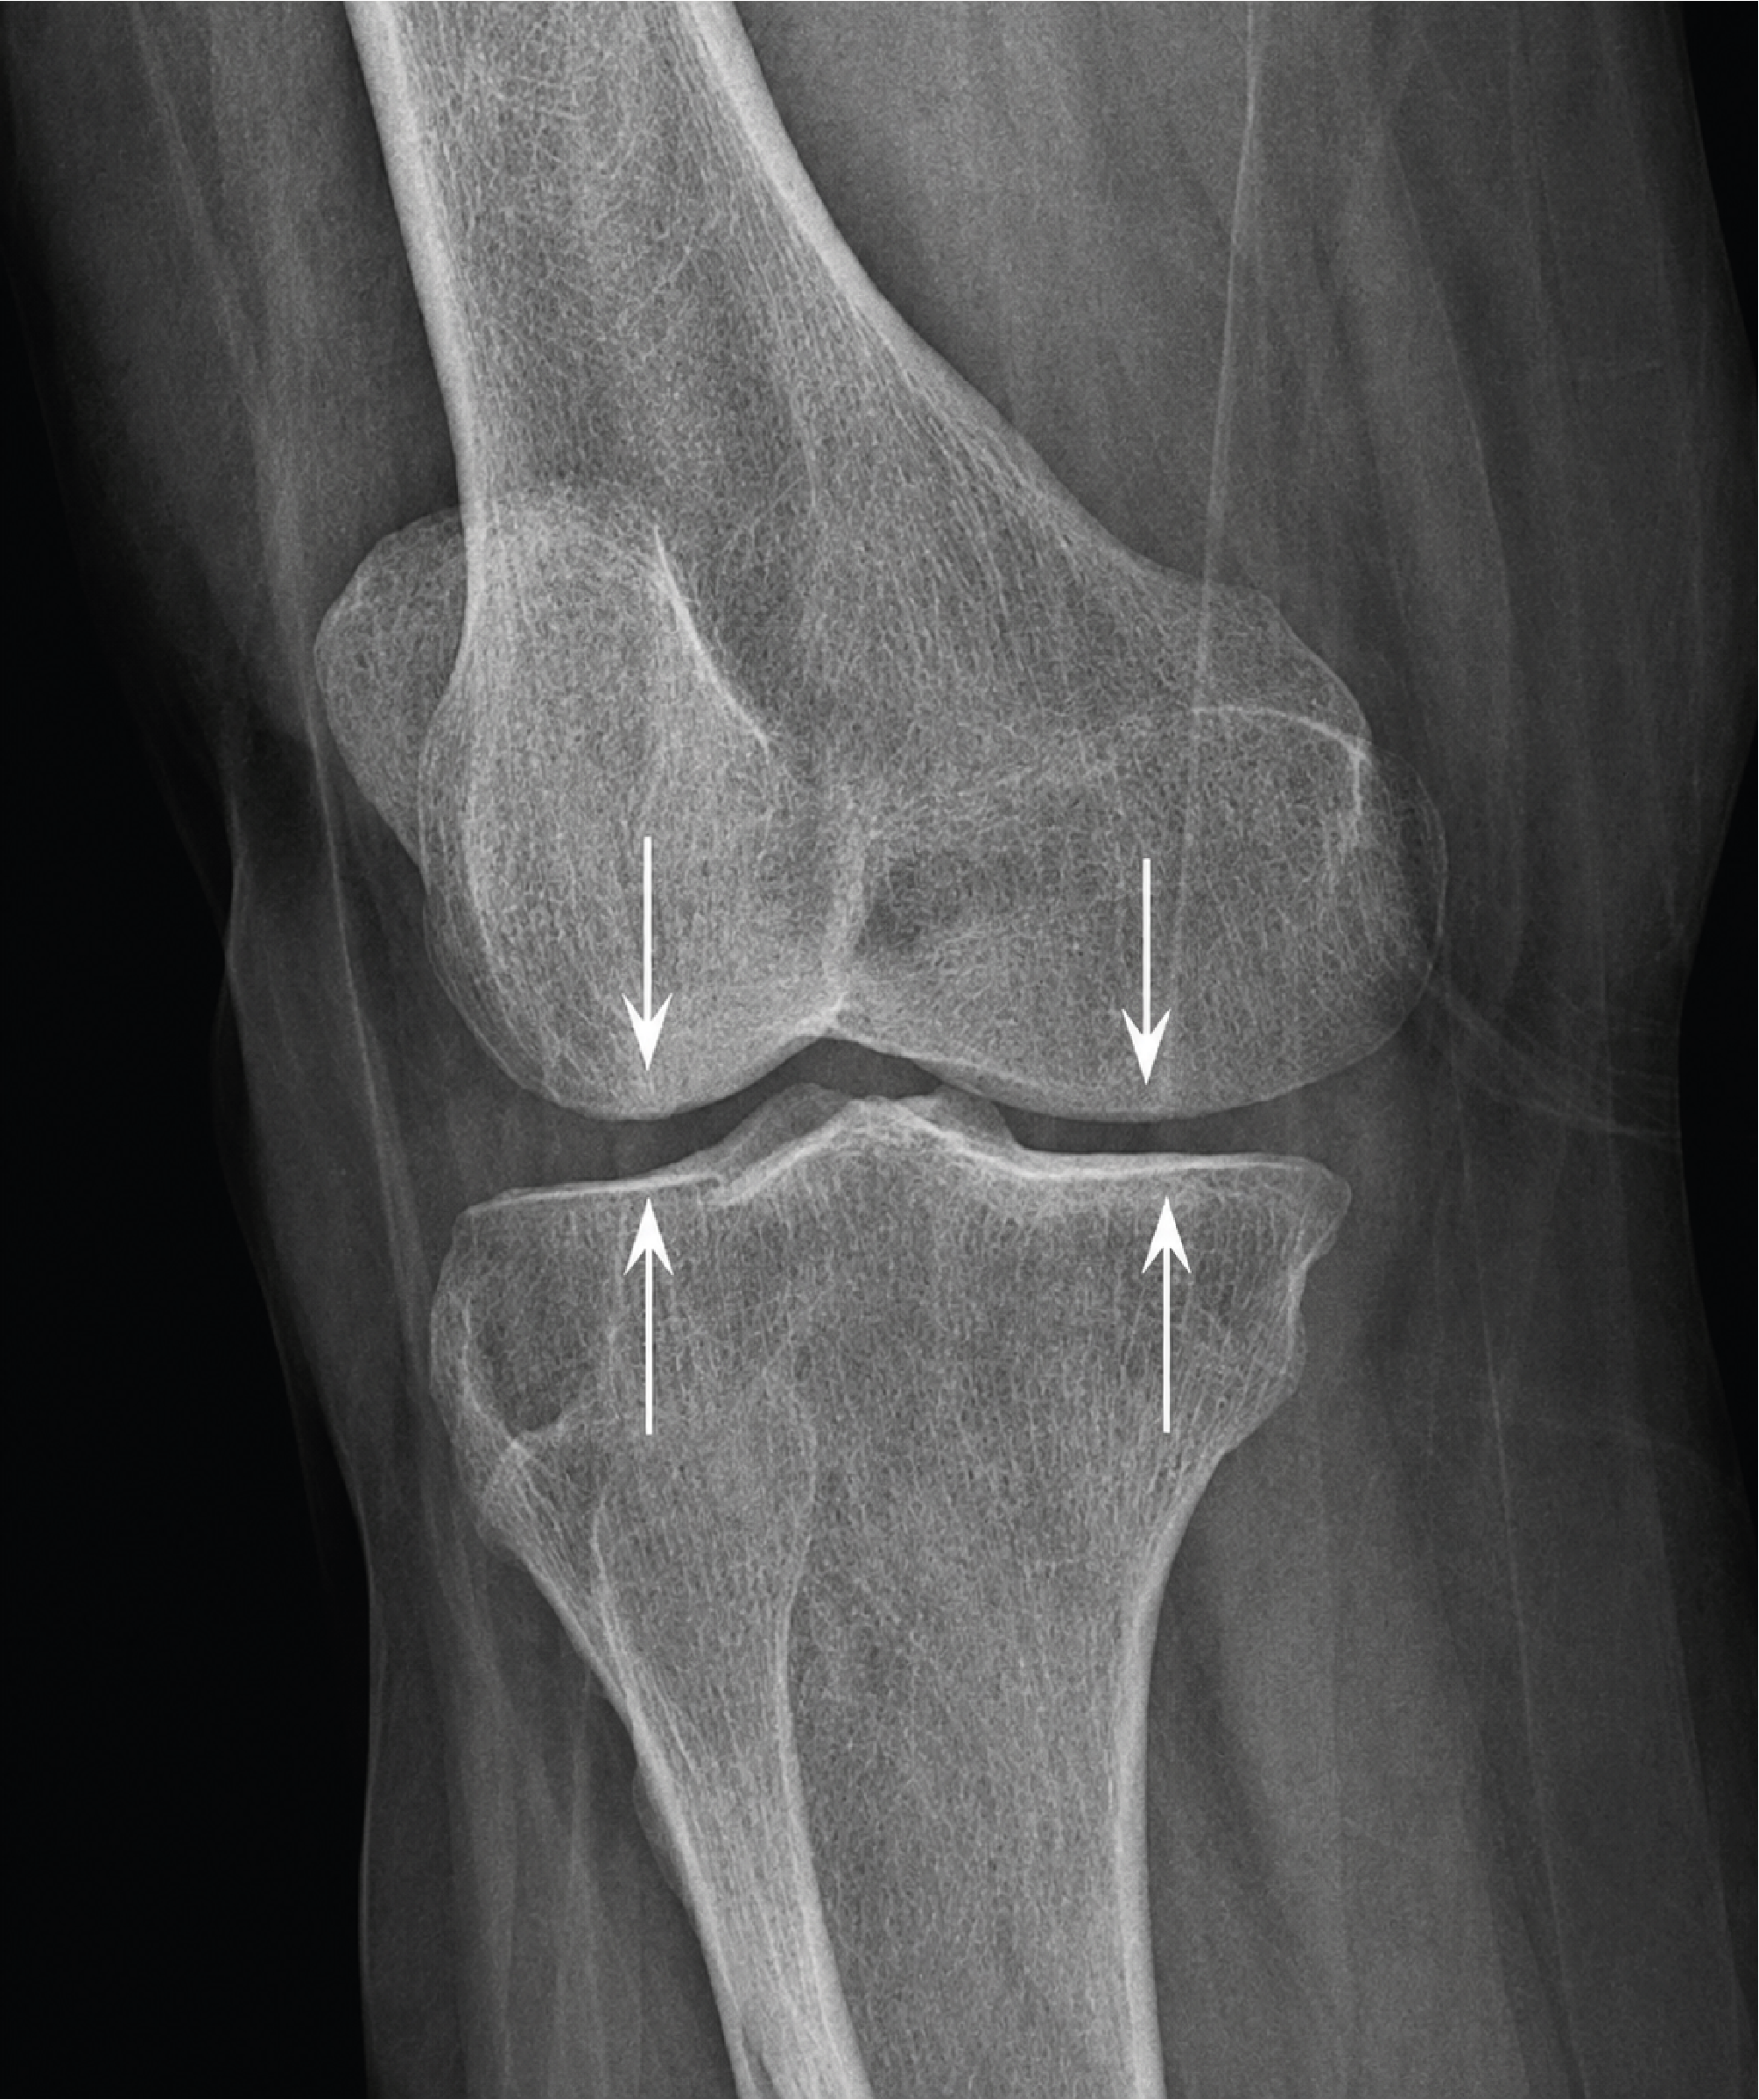
Figure 1. Joint Space Distance (JSD)
Shows reference points for measuring medial and lateral tibio-femoral joint space widths (arrows)
Additional Information
Publisher’s Note
Bayrakol MP remains neutral with regard to jurisdictional and institutional claims.
Rights and Permissions

This work is licensed under a Creative Commons Attribution-NonCommercial 4.0 International License (CC BY-NC 4.0). To view a copy of the license, visit https://creativecommons.org/licenses/by-nc/4.0/
About This Article
How to Cite This Article
Hatice Ağır. Is there a relationship between knee osteoarthritis and osteoporosis?. Ann Clin Anal Med 2024;15(6):399-403. doi:10.4328/ACAM.22085
Publication History
- Received:
- 27.12.2023
- Accepted:
- 12.02.2024
- Published Online:
- 04.04.2024
- Printed:
- 01.06.2024