
Abstract
AimThe aim of this study was to utilize optical coherence tomography-angiography (OCT-A) for evaluating changes in the retinal microvascular network, aiming to predict the cardiovascular risk profile among Acute Coronary Syndrome (ACS) patients and identify potential distinctive markers indicative of atherosclerosis risk.MethodsThis prospective study enrolled patients admitted to the intensive care unit with a diagnosis of ACS. Within the initial 72 hours of ACS onset, patients underwent ophthalmic examination, and selected parameters were assessed using OCT-A. Additionally, blood parameters, electrocardiographic and echocardiographic evaluations of the patients were performed on the first day. Results were compared with a control group.ResultsThe study comprised thirty male patients diagnosed with ACS and thirty healthy controls. OCT-A measurements revealed decreased densities in both the deep and superficial capillary plexuses among the ACS group, particularly notable in the perifoveal region (49.9-52.2, p:0.008). Additionally, the foveal avascular zone (FAZ) appeared broader in the ACS group (0.27-0.24, p:0.039). ACS patients exhibited lower HDL values and elevated white blood cell (WBC) and neutrophil counts compared to controls (P < .001). Moreover, LVEF was significantly diminished in the ACS cohort compared to controls (LVEF: 49.7%-63.1%, P < .001). ConclusionOur findings substantiate the adverse impacts on retinal microvasculature observed in the newly diagnosed Acute Coronary Syndrome (ACS) cohort devoid of known comorbidities or ocular issues. In light of these results, employing OCT-A in ophthalmic screenings is deemed potentially beneficial for predicting the cardiovascular risk profile.
Keywords
Introduction
Atherosclerotic cardiovascular diseases rank prominently among the primary contributors to global mortality and morbidity.1 It is known that endothelial abnormalities plays a role in the physiopathology of coronary heart diseases. Although it plays an important role in many diseases such as hypertension, diabetes mellitus, and coronary artery disease, methods for the direct evaluation of microvascular abnormalities are limited.2 Hence, identifying high-risk patients at the earliest opportunity is imperative to enhance subsequent follow-up and surveillance.
OCT-A holds promise in illustrating early microvascular alterations within retinal vessels attributable to atherosclerosis. OCT-A represents a non-invasive imaging technique capable of producing three-dimensional data pertaining to microvascular architecture. This is achieved through the acquisition and analysis of motion contrast originating from intravascular erythrocytes, utilizing sequential OCT scans focused on a specific retinal region. The evaluation of microvascular structure in retinal examination in previous studies seems promising, as it is similar to the characteristics of coronary and cerebral microvascular structure.3 Furthermore, OCT-A offers the ability to visualize not only the peripapillary capillary network but also the intermediate, deep capillary plexuses. This functionality opens up myriad possibilities for disease characterization and quantification, exploration of disease pathogenesis, and the development and evaluation of innovative treatments.1,4,5 The visualization of retinal microvascular circulation in the posterior segment is achieved through Fundus Fluorescein Angiography (FFA) and alternative imaging modalities. FFA, a technique in clinical use for over 50 years, necessitates intravenous dye injection.6 However, FFA is invasive and limited to visualizing only the superficial vascular plexus.7,8
The objective of this study is to assess alterations in the retinal microvascular network utilizing OCT-A for the appraisal of cardiovascular risk among patients undergoing follow-up for ACS, and to elucidate potential markers indicative of atherosclerosis risk.
Materials and Methods
Between March 1, 2022 and June 30, 2022, 60 eyes of 30 male patients who applied to our hospital with acute coronary syndrome (ACS) and 30 healthy individuals in the control group were included in the study. The research protocol underwent review and received approval from the institutional research ethics committee, in compliance with the principles delineated in the Declaration of Helsinki. Prior to their participation, all subjects provided written informed consent.
The patients presenting with ACS were examined in the Ophthalmology Clinic within the first 3 days and the patients without ocular pathology were included. Routine laboratory tests of the patients were examined. Hemogram, biochemistry parameters and lipid panel values were recorded. Electrocardiographic and echocardiographic evaluations of the patients were performed on the first day, and the results were recorded. As part of the ophthalmological assessment, evaluations were conducted on parameters including intraocular pressure, best corrected visual acuity (BCVA), fundoscopic and biomicroscopic examination, as well as measurements using OCT-A.
Exclusion criteria were determined as described below.
1. Patients with ocular pathology including refraction error of spherical equivalent value greater than +3 or -3, axial length greater than 26 mm, optic neuropathy, glaucoma, optic disc anomaly, vitreoretinal interface disease, retinal vascular disease or degenerative disease, amblyopia, strabismus, uveitis and glaucoma.
2. BCVA less than 10/10.
3. Any systemic disease that may affect the retina and visual pathways for all age groups including diabetes mellitus and hypertension.
4. History of drug use affecting the retina and visual pathways for all age groups.
5. Any anterior or posterior segment pathology that may affect OCT and OCT-A images including advanced cataract, corneal opacity and vitreous opacity.
Axial length (AL) measurements were made with IOL MASTER Carl Zeiss Meditec AG. OCT and OCTA imaging were performed after adequate pupil dilation with one drop of 1% tropicamide. OCT evaluation of all cases was performed with SD-OCT device (Spectralis®, Hiedelberg Engineering, Heidelberg, Germany). Macular thickness and total RNFL thickness measurements were recorded. OCT-A imaging was performed with a commercial OCT-A system (RTVue XR, Angiovue, Inc. Fremont, USA). In the software (Optovue, Version 2018.1.0.37), 6x6 mm OCTA images and 4.5x4.5 mm Optical disc Angiovue images were preferred. The segmentation of the retinal layers into superficial and deep layers was performed automatically using the device’s software. Measurements of vessel density (%) were conducted for both the perifoveal and overall macular areas, corresponding to the Early Treatment Diabetic Retinopathy Study (ETDRS) grid model, specifically targeting the superficial capillary plexus (SCP) and the deep capillary plexus (DCP). Additionally, the device automatically measured the area of the foveal avascular zone (FAZ) (mm²) and the choriocapillaris flow area (mm²) within a 1 mm radius. Vessel density within the optic nerve head was automatically calculated for the 750 μm peripapillary region using AngioVue OCT.Ethical ApprovalThis study was approved by the Ethics Committee of Necmettin Erbakan University (Date: 15.04.2022, Decision No:2022/3749).Statistical AnalysisStatistical analyses were performed using IBM Statistical Package for the Social Sciences (SPSS) Version 23.0 for Windows (SPSS Inc., Chicago, IL, USA). Descriptive statistics were utilized to present mean values for quantitative variables and the number of cases (percentage) for qualitative variables. Normality assumptions of the data were assessed through the Kolmogorov-Smirnov test, skewness, and kurtosis values. Upon confirmation of normality assumptions, relationships were examined using crosstables and chi-square statistics.Reporting GuidelinesThis study was reported in accordance with the STROBE guideline.
Results
No significant differences were observed between the ACS group and the control group with respect to age and gender. Heart rates and electrocardiographic findings of the patients were similar. Among the laboratory parameters of the patients, total cholesterol and LDL values in the ACS group were found to be high, although not statistically significant. HDL levels were significantly lower in the ACS group (31.6-45.1, P < .001), and WBC and neutrophil counts were significantly higher in the ACS group when compared to controls (9.8-6.8 and 6.6-3.8, respectively, P < .001). Ejection fraction was significantly lower (49.7-63.1, P < .001) and left ventricular end-diastolic diameter was significantly higher (4.8-4.5, p:0.012) in the ACS group (Table 1). In the optical measurements of the patients, decreased densities were observed in both the capillary plexuses within the ACS group, with particular emphasis on the diminished SCP density, notably in the perifoveal region (49.9-52.2, p:0.008) (Table 2, Table 3).
Discussion
In this study, we examined the impact of atherosclerosis on the macular microvasculature of young male patients diagnosed with acute coronary syndrome. Atherosclerosis has been linked to various vascular alterations, encompassing modifications in retinal and choroidal blood flow, along with experimental evidence of endothelial reactivity.
The changes detected in quantitative measurements of retinal microvasculature by OCT-A suggested that OCT-A could be used to reveal the effects of atherosclerosis in the early period. The resulting changes in retinal microvascular structure in many systemic diseases have been evaluated with OCT-A. In recent years, OCT-A has been used to analyze retinal microvascular changes in systemic disorders affecting vascular structure, such as diabetes mellitus (DM) and hypertension.9,10 In diabetic patient studies, eyes without diabetic retinopathy were found to have retinal microcirculation abnormalities.11
Hypertension was associated with vessel density reduction in the Deep Retinal Layer (DRL) and Superficial Retinal Layer (SRL), especially in the macular zone.12 In addition, research has demonstrated that the vessel density values in the foveal and parafoveal regions of the DRL are higher in individuals without a history of hypertension, lower in patients with a recent diagnosis of HTN (un-treated patients), and lowest in patients with uncontrolled HTN.13 Other studies indicate that increase in the FAZ area in Superficial and Deep Retinal Layer is also associated with prolonged hypertension.14
Multiple investigations have reported a reduction in vascular density within the SRL, DRL, and CCL within the macular region of diabetic patients without diabetic retinopathy.15 Moreover, Kim et al. identified a notable decrease in vessel density within the SRL of the peri- and parafoveal regions.10 Ale-Chilet et al. explored the impact of cardiovascular disease risk factors on OCT-A parameters in a cohort of type 1 diabetic individuals. They identified significant correlations between parafoveal vessel density and factors such as smoking status, body mass index (BMI), hypertension, elevated triglyceride levels, and the use of antiplatelet agents and statins. Notably, the use of antiplatelet agents and elevated triglyceride levels exhibited a significant association with parafoveal vessel density.16 Several studies have demonstrated a considerable enlargement in the FAZ area and perimeter within both the DRL and SRL among diabetic patients without diabetic retinopathy compared to healthy individuals.17 In addition, the OCT-A findings of the retinal microvascular structure of smokers have been investigated. Sizmaz et al. discovered a reduction in choroidal thickness in smokers, and they hypothesized that this was due to smoking’s effect on choroidal blood flow.18 Ciloğlu et al. found that smokers exhibited an enlargement of the FAZ and a decrease in vessel density within the DCP compared to non-smokers.19
Retinal microvascular changes have been detected in individuals with chronic kidney disease, often preceding the onset of visual symptoms. These changes can serve as predictive indicators of declining renal function in those with chronic kidney disease and may also signify an increased risk of cardiovascular disease. Chronic kidney disease was correlated with significantly decreased parafoveal vascular density values in both the SRL and DRL.20 In a study that examined the effect of carotid endarterectomy on OCTA findings, it was found that the stenosis group had decreased vascular density in both the retinal peripapillary capillary layer.21
The EYE-MI study conducted by Arnold et al. demonstrated the promising utility of quantitative evaluation of the retinal microvascular network using OCT-A for assessing the cardiovascular risk profile in individuals with a history of myocardial infarction. Regardless of hemodynamic fluctuations, a heightened AHA (American Heart Association) risk score correlated with diminished retinal vascular density.22 In a study evaluating vascular density in the retina and choroid between patients with coronary artery disease and a matched group of healthy individuals, Wang et al. revealed a remarkable decrease in vascular density in the foveal region.23
Endothelial dysfunction contributes to every stage, spanning from the initiation of atherosclerosis to the development of complications.24 In a normal endothelium, relaxation and contraction factors have a delicate balance. Nitric Oxide (NO) plays an important role in the relaxation arm in this balance. Superoxide anions formed as a result of oxidative stress are known to inhibit NO activity and cause vasoconstriction-mediated endothelial dysfunction. The idea that this process starts early is increasing and it is expected that earlier diagnosis and intervention will lead to a reduction in cardiovascular risks.25
In our study, young, newly diagnosed ACS patients without additional disease were screened. Superficial capillary plexus (SCP) vessel density and deep capillary plexus (DCP) vessel density measured by automatic segmentation analysis in the whole retinal area and perifoveal area, according to the statistical results of the parameters measured in people with confirmed atherosclerosis was found to be significantly lower than the control group. Vascular damage detected significantly in patients with ACS was seen to reflect the decrease in retinal vessel density. This result; ACS of OCT-A technology reveals the potential as a powerful tool for detecting preclinical retinal microvascular changes.
Another significant finding in the study when compared to the control group is the foveal avascular zone (FAZ) values. Here, the significant enlargement in the FAZ area measured in the choriocapillaris region in the ACS group was thought to be a result of the decrease in retinal capillary density and deterioration in microcirculation, which occurs as a result of cardiovascular deterioration. Small changes in the retinal vessels may serve as an indicator of potential damage to vital organs like the brain and heart.
Limitations
The most important limitation in our study is the small number of patients. In addition, being a single-center study and recruiting patients in a limited period of time are other limitations.
Conclusion
Upon evaluating the outcomes of our study, it was noted that impaired myocardial reperfusion led to a reduction in retinal microcirculation within the ACS group during the initial phase compared to the control group in OCT-A analysis.
The authors disclose no conflicts of interest and did not use any artificial intelligence-assisted technology in the study.
Declarations
Animal and Human Rights Statement
All procedures performed in this study were in accordance with the ethical standards of the institutional and/or national research committee and with the 1964 Helsinki Declaration and its later amendments or comparable ethical standards.
Informed Consent
Written informed consent was obtained from all participants.
Data Availability
The datasets used and/or analyzed during the current study are not publicly available due to patient privacy reasons but are available from the corresponding author on reasonable request.
Conflict of Interest
The authors declare that there is no conflict of interest.
Funding
None.
Abbreviations
ACS: Acute coronary syndrome
AHA: American Heart Association
AL: Axial length
ALT: Alanine aminotransferase
AXL: Axial length
BCVA: Best corrected visual acuity
BMI: Body mass index
BUN: Blood urea nitrogen
CCL: Choriocapillaris layer
CRP: C-reactive protein
DCP: Deep capillary plexus
DM: Diabetes mellitus
DRL: Deep retinal layer
EDI-OCT: Enhanced depth imaging optical coherence tomography
ETDRS: Early Treatment Diabetic Retinopathy Study
FAZ: Foveal avascular zone
FFA: Fundus fluorescein angiography
GFR: Glomerular filtration rate
HDL: High-density lipoprotein
HTN: Hypertension
LDL: Low-density lipoprotein
LVEDD: Left ventricular end-diastolic diameter
LVEF: Left ventricular ejection fraction
LVESD: Left ventricular end-systolic diameter
NO: Nitric oxide
OCT: Optical coherence tomography
OCT-A: Optical coherence tomography angiography
PR: Distance between P wave beginning and R wave
QRS: Distance between the beginning of the Q wave and end of the S wave
RNFL: Retinal nerve fiber layer
SCP: Superficial capillary plexus
SD-OCT: Spectral-domain optical coherence tomography
SPSS: Statistical Package for the Social Sciences
SRL: Superficial retinal layer
WBC: White blood cell
References
- Arnould L, Guenancia C, Bourredjem A, et al. Prediction of cardiovascular parameters with supervised machine learning from Singapore “I” vessel assessment and OCT-angiography: a pilot study. Transl Vis Sci Technol. 2021;10(13):20. doi:10.1167/tvst.10.13.20
- Bergmark BA, Mathenge N, Merlini PA, Lawrence-Wright MB, Giugliano RP. Acute coronary syndromes. Lancet. 2022;399(10332):1347-1358. doi:10.1016/s0140-6736(21)02391-6
- Hannappe MA, Arnould L, Méloux A, et al. Vascular density with optical coherence tomography angiography and systemic biomarkers in low and high cardiovascular risk patients. Sci Rep. 2020;10(1):16718. doi:10.1038/s41598-020-73861-z
- Aschauer J, Aschauer S, Pollreisz A, et al. Identification of subclinical microvascular biomarkers in coronary heart disease in retinal imaging. Transl Vis Sci Technol. 2021;10(13):24. doi:10.1167/tvst.10.13.24
- Theuerle JD, Al-Fiadh AH, Wong E, et al. Retinal microvascular function predicts chronic kidney disease in patients with cardiovascular risk factors. Atherosclerosis. 2022;341:63-70. doi:10.1016/j.atherosclerosis.2021.10.008
- Gadde SG, Anegondi N, Bhanushali D, et al. Quantification of vessel density in retinal optical coherence tomography angiography images using local fractal dimension. Invest Ophthalmol Vis Sci. 2016;57(1):246-252. doi:10.1167/iovs.15-18287
- Spaide RF, Fujimoto JG, Waheed NK, Sadda SR, Staurenghi G. Optical coherence tomography angiography. Prog Retin Eye Res. 2018;64:1-55. doi:10.1016/j.preteyeres.2017.11.003
- Lim CW, Cheng J, Tay ELT, et al. Optical coherence tomography angiography of the macula and optic nerve head: microvascular density and test-retest repeatability in normal subjects. BMC Ophthalmol. 2018;18(1):315. doi:10.1186/s12886-018-0976-y
- Donati S, Maresca AM, Cattaneo J, et al. Optical coherence tomography angiography and arterial hypertension: a role in identifying subclinical microvascular damage? Eur J Ophthalmol. 2021;31(1):158-165. doi:10.1177/1120672119880390
- Kim K, Kim ES, Yu SY. Optical coherence tomography angiography analysis of foveal microvascular changes and inner retinal layer thinning in patients with diabetes. Br J Ophthalmol. 2018;102(9):1226-1231. doi:10.1136/bjophthalmol-2017-311149
- Gu S, Li Z, Zhang Y, et al. Optical coherence tomography angiography findings of microvascular and neural changes in primary pulmonary hypertension. Retina. 2021;41(4):784-792. doi:10.1097/iae.0000000000002940
- Chua J, Chin CWL, Hong J, et al. Impact of hypertension on retinal capillary microvasculature using optical coherence tomographic angiography. J Hypertens. 2019;37(3):572-580. doi:10.1097/hjh.0000000000001916
- Lim HB, Lee MW, Park JH, Kim K, Jo YJ, Kim JY. Changes in ganglion cell-inner plexiform layer thickness and retinal microvasculature in hypertension: an optical coherence tomography angiography study. Am J Ophthalmol. 2019;199:167-176. doi:10.1016/j.ajo.2018.11.016
- Hua D, Xu Y, Zeng X, et al. Use of optical coherence tomography angiography for assessment of microvascular changes in the macula and optic nerve head in hypertensive patients without hypertensive retinopathy. Microvasc Res. 2020;129:103969. doi:10.1016/j.mvr.2019.103969
- Dimitrova G, Chihara E, Takahashi H, Amano H, Okazaki K. Quantitative retinal optical coherence tomography angiography in patients with diabetes without diabetic retinopathy. Invest Ophthalmol Vis Sci. 2017;58(1):190-196. doi:10.1167/iovs.16-20531
- Alé-Chilet A, Barraso M, Hernandez T, Oliva C, Adán A, Zarranz-Ventura J. Cardiovascular risk factors impact in perifoveal flow in type 1 diabetes mellitus assessed by OCT angiography. Invest Ophthalmol Vis Sci. 2018;59(9):1907-1914.
- De Carlo TE, Chin AT, Bonini Filho MA, et al. Detection of microvascular changes in eyes of patients with diabetes but not clinical diabetic retinopathy using optical coherence tomography angiography. Retina. 2015;35(11):2364-2370. doi:10.1097/iae.0000000000000882
- Sizmaz S, Küçükerdönmez C, Pinarci EY, Karalezli A, Canan H, Yilmaz G. The effect of smoking on choroidal thickness measured by optical coherence tomography. Br J Ophthalmol. 2013;97(5):601-604.
- Ciloğlu E, Unal F, Sukgen EA, Kocluk Y, Dogan NC. Evaluation of foveal avascular zone and capillary plexus in smokers using optical coherence tomography angiography. J Curr Ophthalmol. 2020;32(1):53-57.
- Maurice DM. A scanning slit optical microscope. Invest Ophthalmol. 1974;13(12):1033-1037.
- Arnould L, Guenancia C, Azemar A, et al. The EYE-MI pilot study: a prospective acute coronary syndrome cohort evaluated with retinal optical coherence tomography angiography. Invest Ophthalmol Vis Sci. 2018;59(10):4299-4306. doi:10.1167/iovs.18-24090
- Wang J, Jiang J, Zhang Y, Qian YW, Zhang JF, Wang ZL. Retinal and choroidal vascular changes in coronary heart disease: an optical coherence tomography angiography study. Biomed Opt Express. 2019;10(4):1532-1544. doi:10.1364/boe.10.001532
- Monteiro-Henriques I, Rocha-Sousa A, Barbosa-Breda J. Optical coherence tomography angiography changes in cardiovascular systemic diseases and risk factors: a review. Acta Ophthalmol. 2022;100(1).
- Liu DW, Haq Z, Yang D, Stewart JM. Association between smoking history and optical coherence tomography angiography findings in diabetic patients without diabetic retinopathy. PLoS One. 2021;16(7). doi:10.1371/journal.pone.0253928
- Ayhan Z, Kaya M, Ozturk T, Karti O, Oner FH. Evaluation of macular perfusion in healthy smokers by using optical coherence tomography angiography. Ophthalmic Surg Lasers Imaging Retina. 2017;48(8):617-622. doi:10.3928/23258160-20170802-03
Tables
Table 1. Average Age and Ratio of Smokers in the Patient and Control Groups
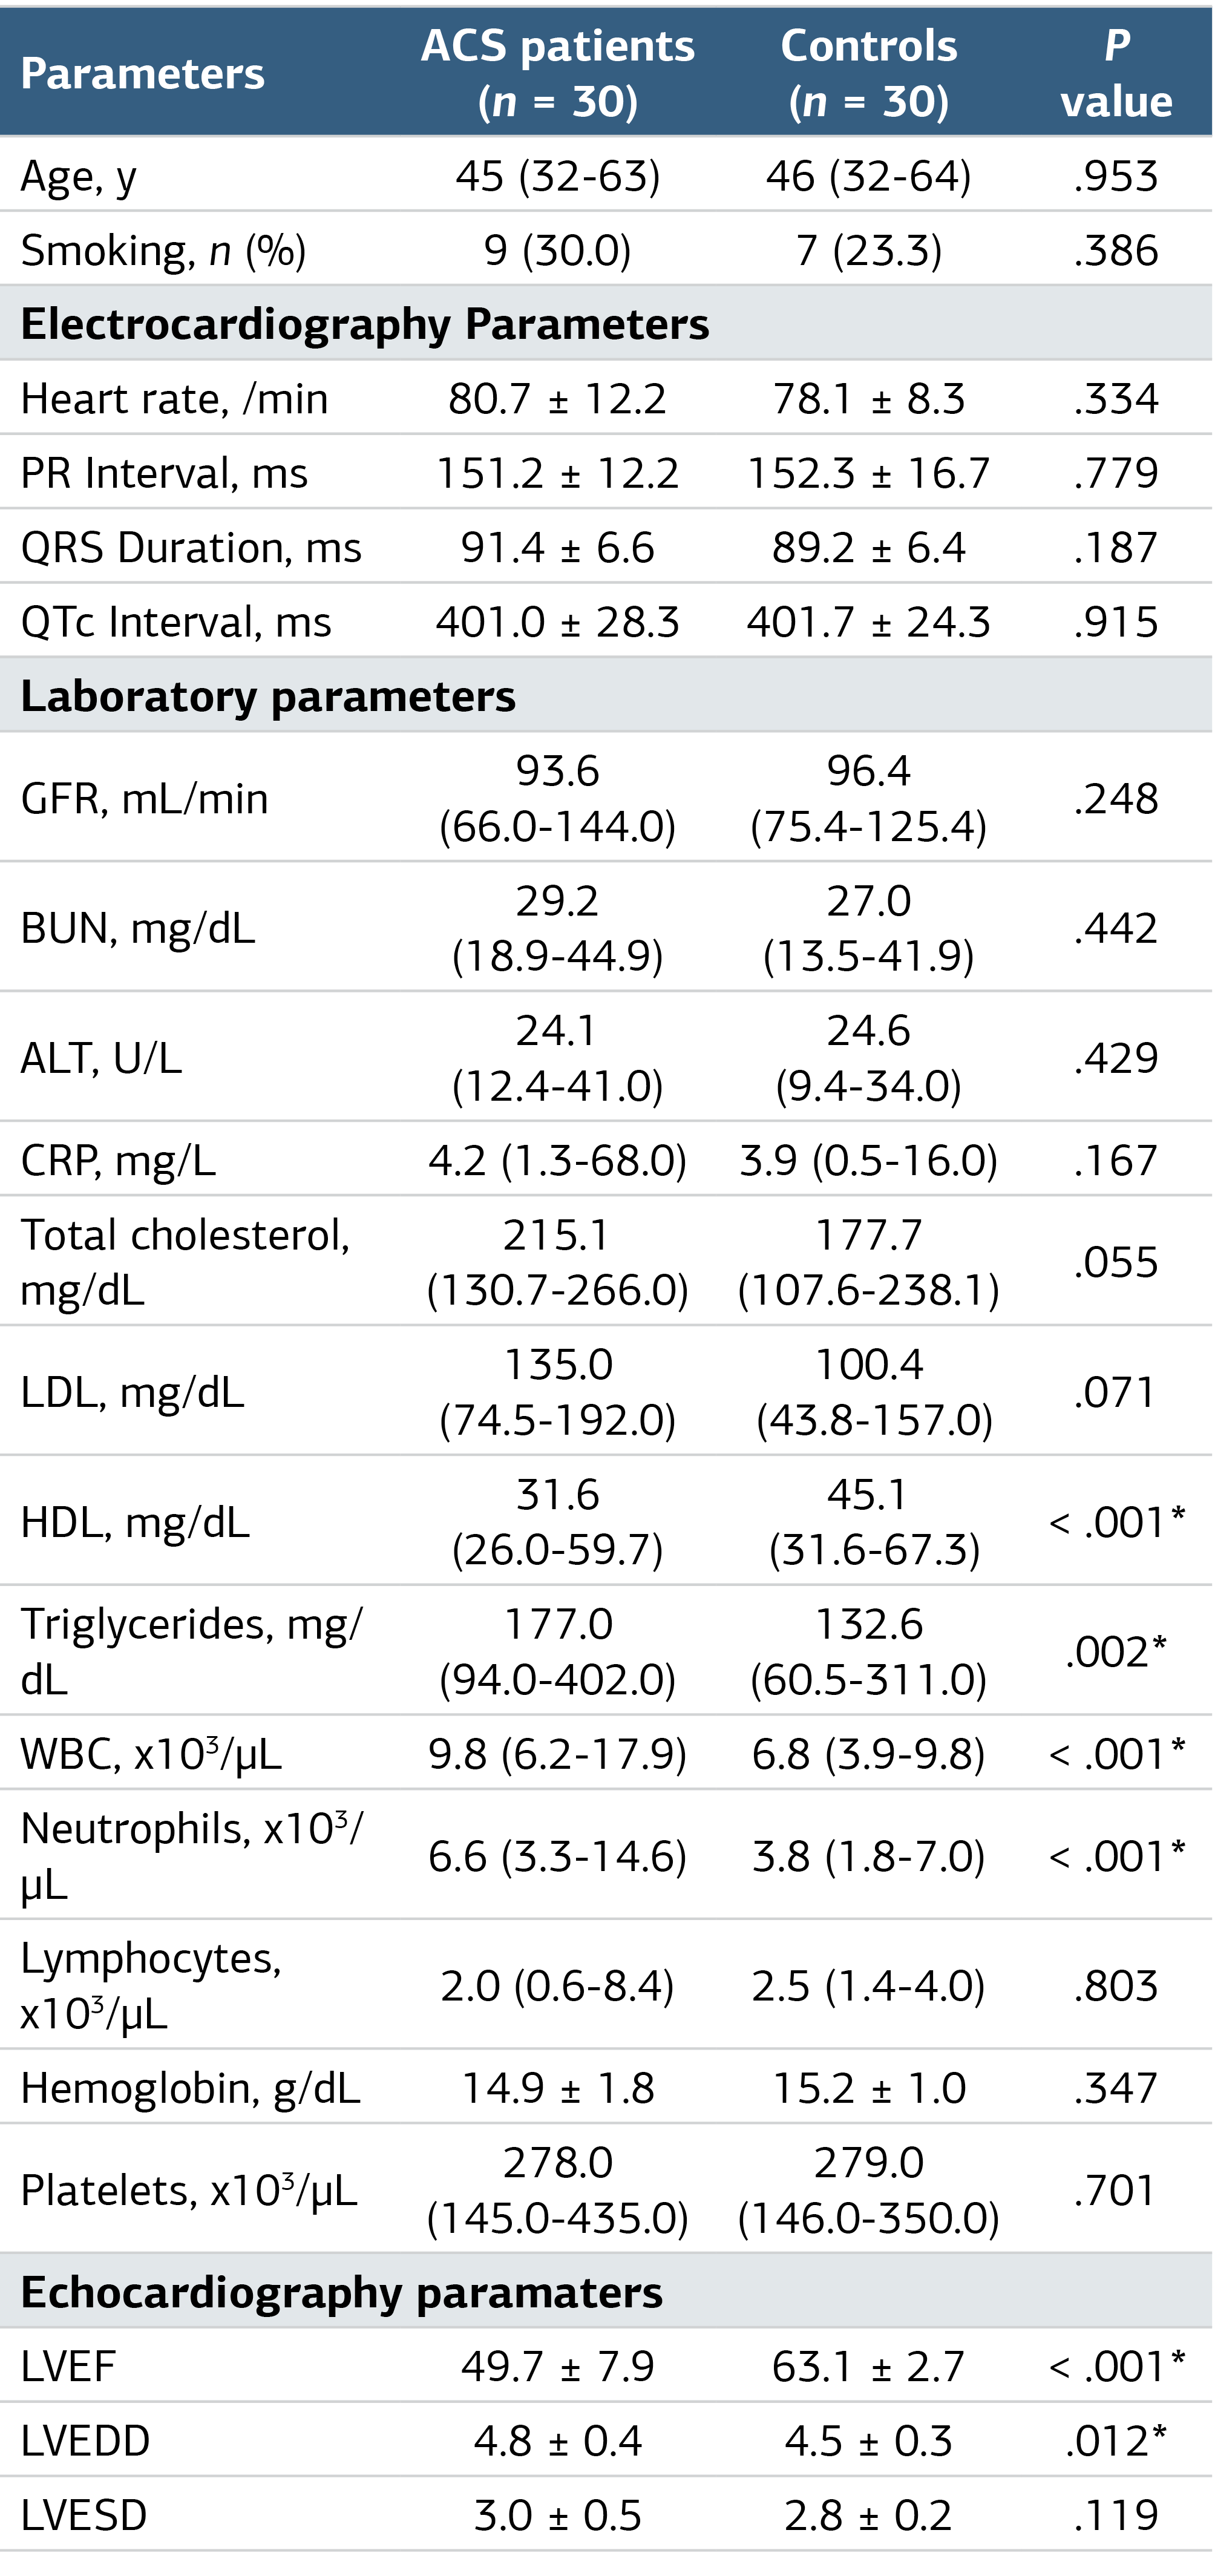
ACS, acute coronary syndrome; PR, distance between P wave beginning and R wave; QRS, distance between the beginning of the Q wave and end of the S wave; QTc, corrected QT length; ALT, alanine aminotransferase; BUN, blood urea nitrogen; CRP, C-reactive protein; GFR, glomerular filtration rate; HDL, high density lipoprotein; LDL, low density lipoprotein; LVEDD, left ventricular end diastolic diameter; LVEF, left ventricular ejection fraction; LVESD, left ventricular end systolic diameter.
Table 2. Optical Coherence Tomography Angiography of Patient and Control Groups
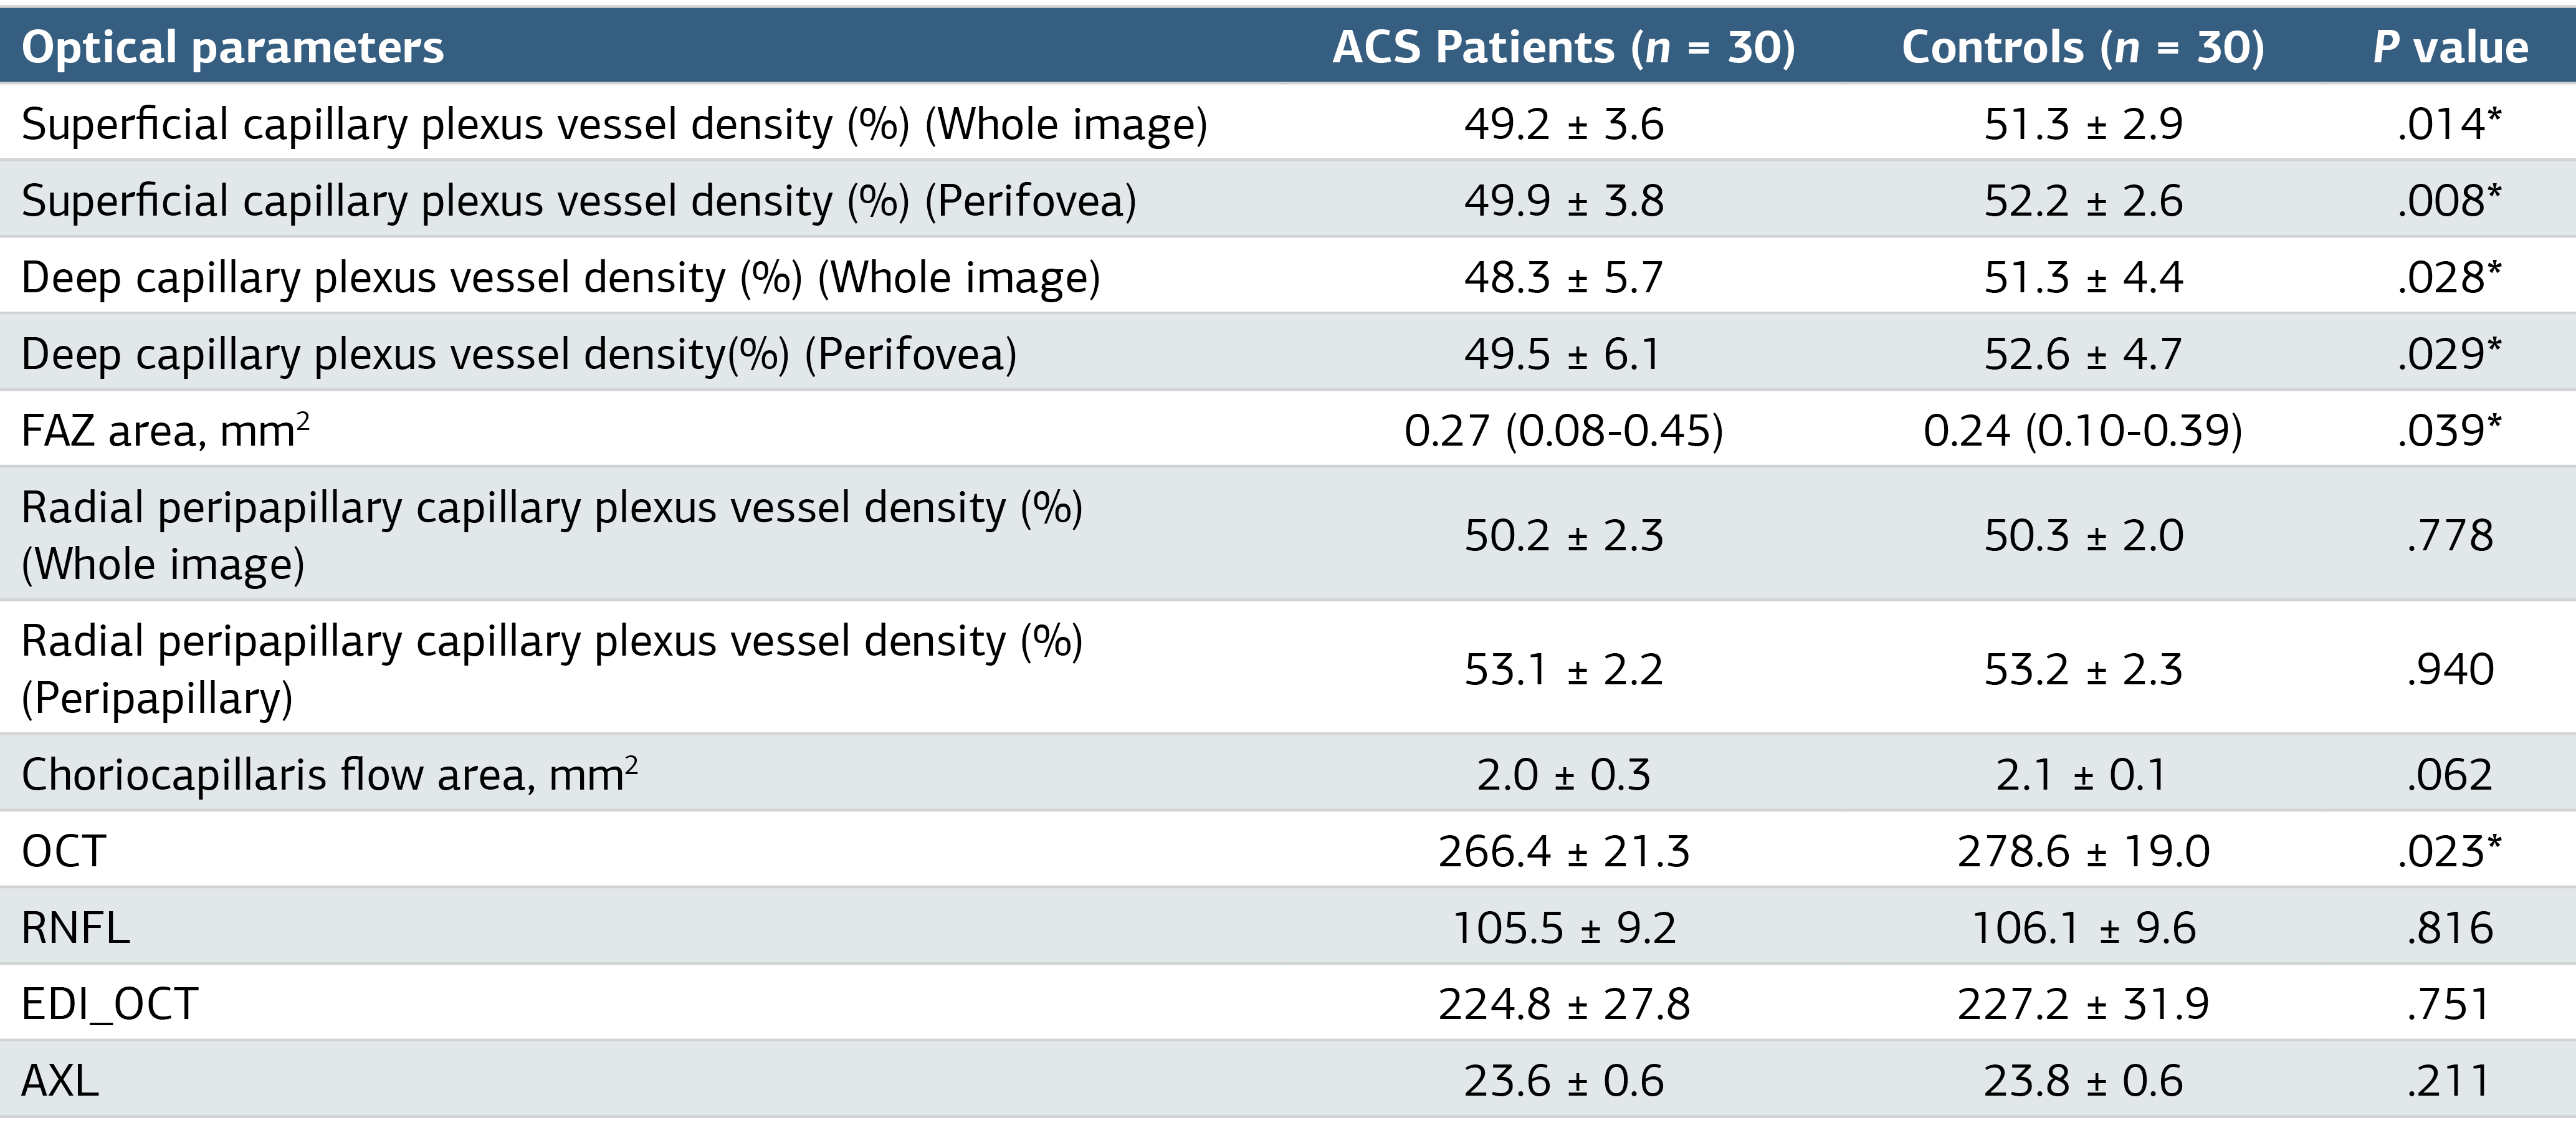
P < .05 denotes statistical significance; ACS, acute coronary syndrome; OCT, optical coherence tomography; RNFL, retinal nerve fiber layer ; EDI_OCT, enhanced depth imaging optical coherence tomography; AXL, axial length.
Table 3. Regression Analyses for the Prediction of Acute Coronary Syndrome
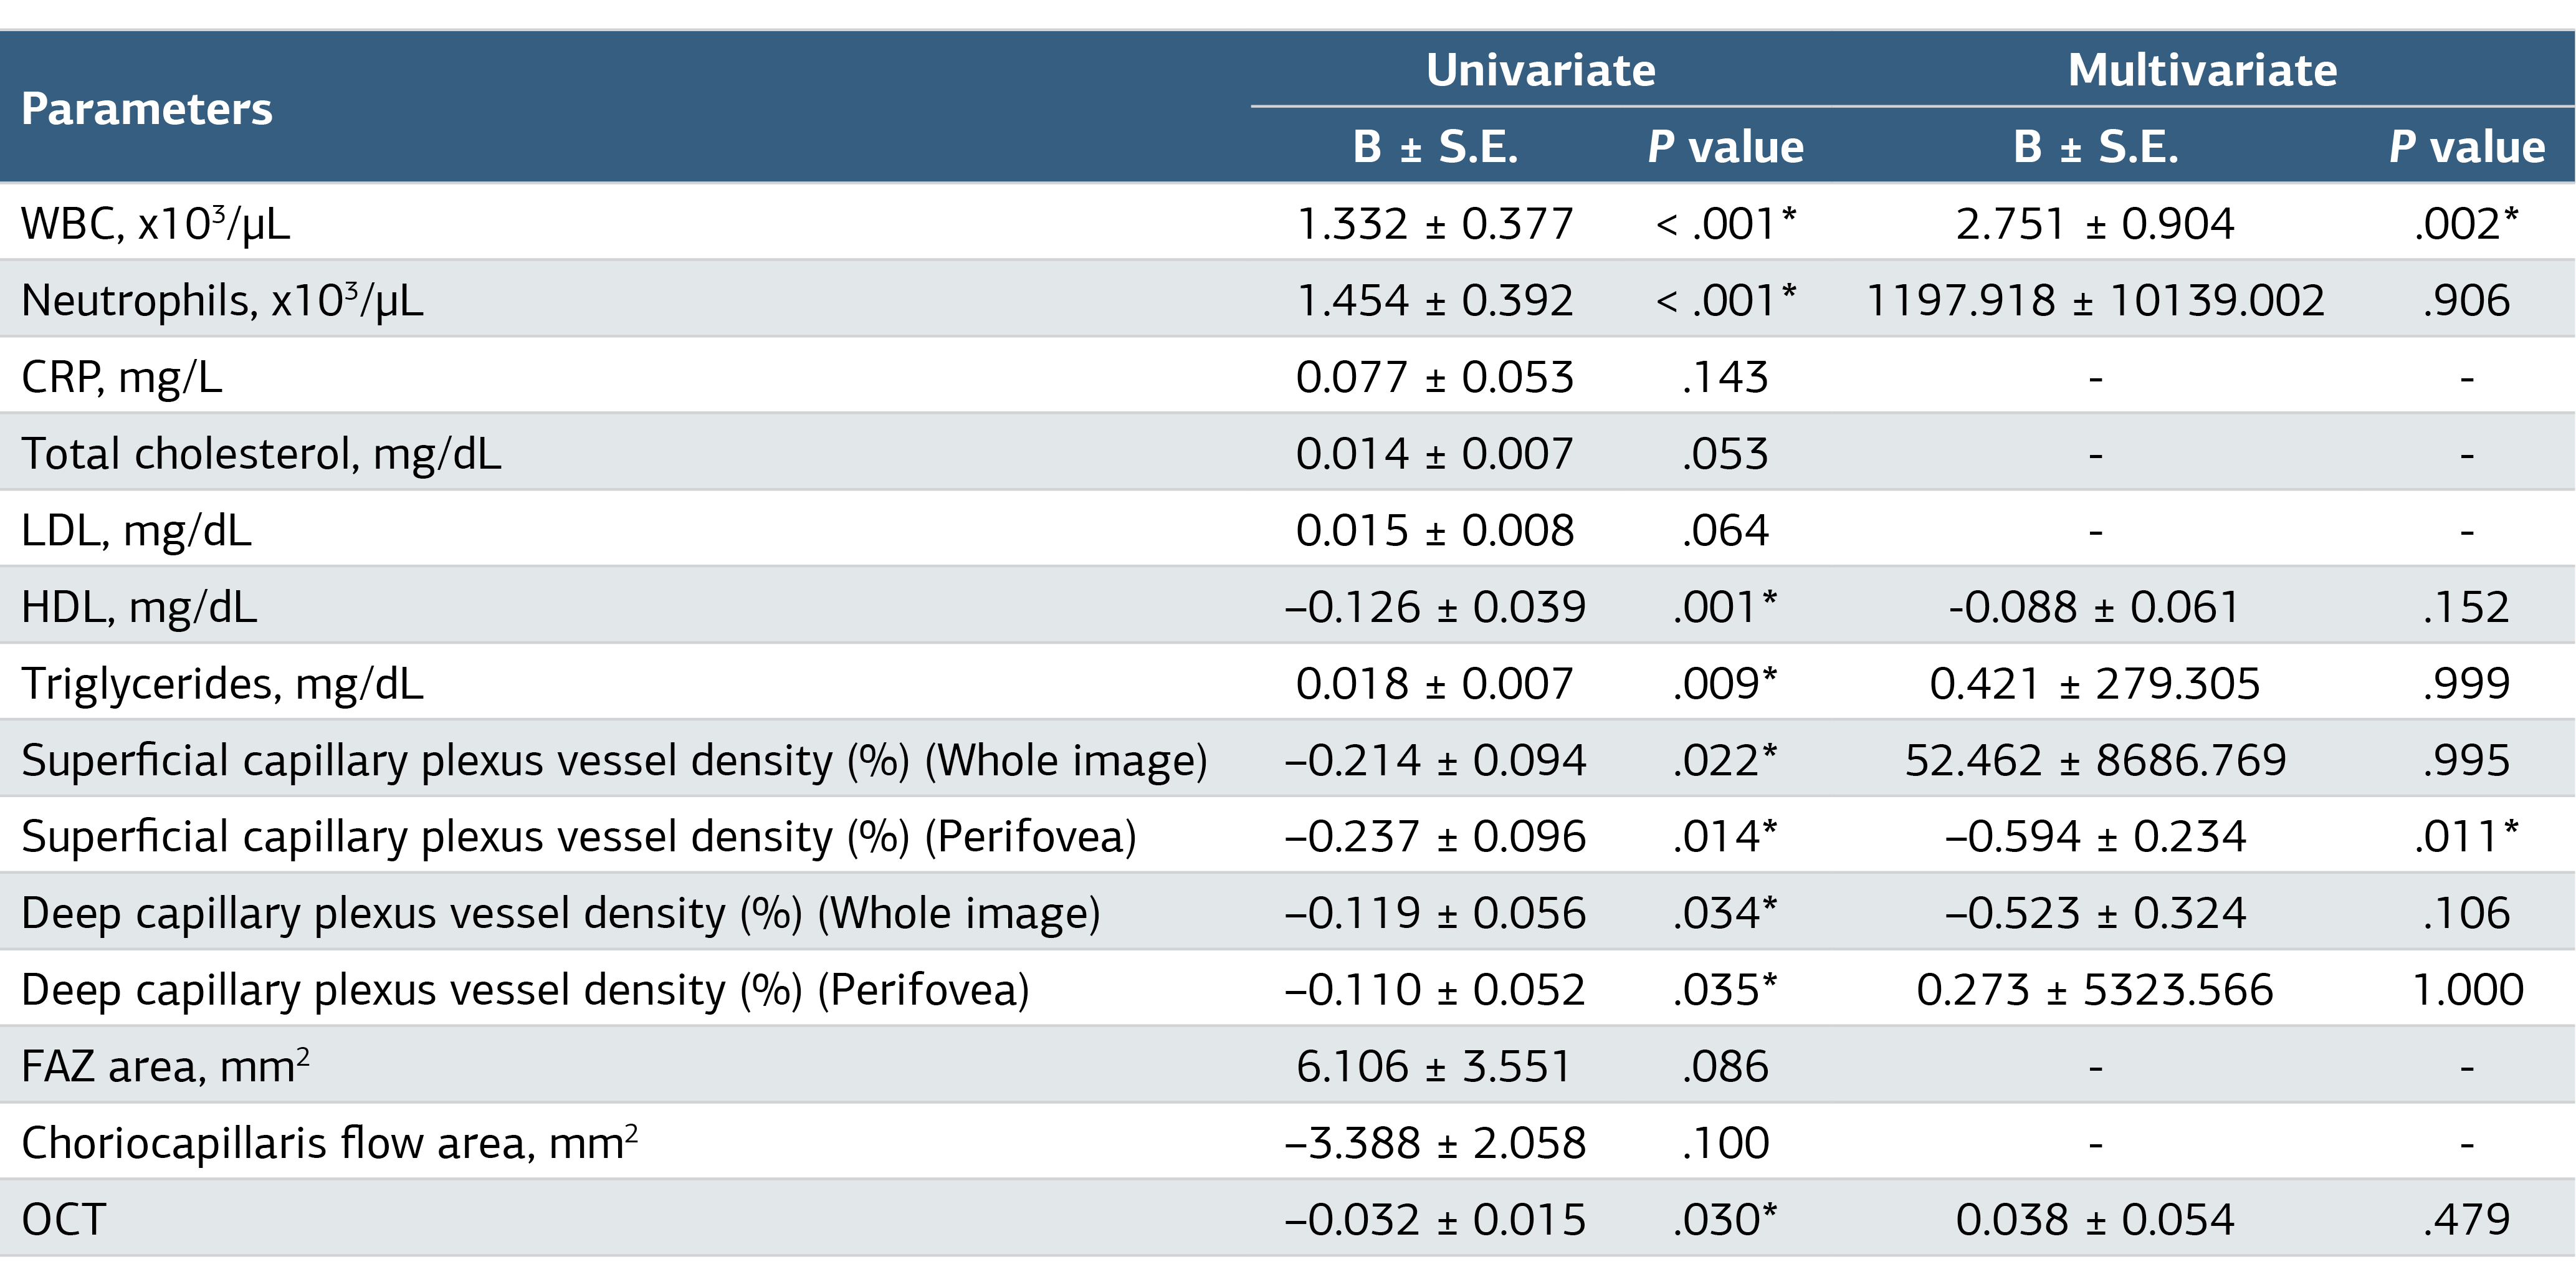
*P < .05 denotes statistical significance
Additional Information
Publisher’s Note
Bayrakol MP remains neutral with regard to jurisdictional and institutional claims.
Rights and Permissions

This work is licensed under a Creative Commons Attribution-NonCommercial 4.0 International License (CC BY-NC 4.0). To view a copy of the license, visit https://creativecommons.org/licenses/by-nc/4.0/
About This Article
How to Cite This Article
Ahmet Taha Şahin, Ahmet Lütfü Sertdemir, Abdullah İçli, Rüveyda Baloğlu, Günhal Şatırtav Akdeniz, Serhat Kesriklioğlu. Optical coherence tomography angiography evaluation of retinal microvascular structure in young male patients presenting with acute coronary syndrome. Ann Clin Anal Med 2024;15(8):591-595. doi:10.4328/ACAM.22272
Publication History
- Received:
- 20.05.2024
- Accepted:
- 02.07.2024
- Published Online:
- 05.07.2024
- Printed:
- 01.08.2024