
Abstract
AimThe study aims to analyze indicators of systemic inflammation such as platelet-lymphocyte ratio, monocyte-lymphocyte ratio and neutrophil-lymphocyte ratio in patients with hyperemesis gravidarum (HEG).Methods130 patients diagnosed with HEG according to the criteria of persistent vomiting, ketonuria, electrolyte abnormalities and acid-base disorder constituted the study group. 134 healthy pregnant women, whose age and gestational weeks were matched, constituted the control group. HEG was diagnosed in patients with ketonuria accompanied by a loss of more than 5 percent of their pre-pregnancy weight and vomiting more than three times a day. Both groups were compared in terms of demographic characteristics, hematological parameters and inflammation markers. The relationship between ketonuria severity and inflammation markers of patients in the HEG group was also analyzed.ResultsThe average age of participants was found to be 8.67 ± 5.72. BMI, parity, and weight of patients in the HEG group were found to be significantly lower than those of controls. HB and hematocrit values of the HEG group were found to be significantly higher than controls (P < .001). NLO values of patients with 1+ ketonuria were significantly lower than those with 3+ ketonuria (P < .01). PLO values of patients with 3+ ketonuria were significantly higher than those with 1+ and 2+ ketonuria (P = .005; P = .013; P < .05). MLO measurements of cases with 3+ ketonuria were significantly higher than those with 1+ and 2+ ketonuria. ConclusionThe relationship between NLO, MLO, PLO and ketonuria in HEG can be used to monitor the effectiveness of treatment and evaluate the development of complications.
Keywords
Introduction
Hyperemesis gravidarum (HEG) is a pregnancy-specific process characterized by persistent vomiting unrelated to other causes of vomiting in pregnancy, inability to feed, ketonuria, and deterioration in electrolyte and acid-base balance.1 HEG, which is most common in non-smoking primiparous pregnant women, is the most common reason for hospitalization in the first half of pregnancy.2-4 Although it varies depending on the population studied and ethnicity, the prevalence of hyperemesis gravidarum varies between 0.3 and 10.8%.1,2 Differences in the criteria used for diagnosis are considered to be the cause of different prevalences.2-4 It has been reported that the incidence increases significantly when mild pregnancy nausea and vomiting that does not cause electrolyte imbalance is considered as HEG.4 If not monitored and treated appropriately, it can cause morbidity in the mother and her fetus. Although most cases of HEG go into remission with diet and lifestyle changes, one in three patients experience findings that may require hospitalization, antiemetics, liquid electrolyte support and vitamin supplements.2 Depending on the severity of HEG, changes in laboratory parameters may be in a wide spectrum, ranging from hyponatremia and hypokalemia to alkylosis.4 It is not surprising to encounter, in rare cases, weight loss, tachycardia, hypotension, skin changes and psychiatric problems.1,2
Although the etiology of HEG is mostly attributed to genetic, hormonal and infectious etiologies, in the last decade it has been emphasized that the expression defect of placenta-derived proteins and the increase in placental and systemic inflammation are important in the emergence of the disease.2,5 In fact, studies reporting a positive relationship between the severity of ketonuria and inflammatory markers have begun to be published.5-7 Hematological parameters such as mean platelet volume (MPV), platelet distribution width (PDW), red cell distribution width (RDW), plateletcrit (PCT), platelet-to-lymphocyte ratio (PLO), neutrophil-to-lymphocyte ratio (NLO) and monocyte-to-lymphocyte ratio (MLO) are widely used to show the inflammatory background of many diseases.8 Detecting the levels of inflammatory markers by ELISA or PCR method is expensive and time-consuming. Inflammatory markers measured with the help of venous blood samples provide a faster, easier and cheaper alternative for early diagnosis of the disease and initiation of treatment. This study was planned to analyze indicators of systemic inflammation such as platelet-lymphocyte ratio, monocyte-lymphocyte ratio and neutrophil-lymphocyte ratio, in addition to mean platelet volume, platelet distribution width, plateletcrit and red cell distribution width of patients diagnosed with HEG. The relationship between inflammatory markers and severity of katonuria was also analyzed.
Materials and Methods
This case-controlled thesis study was conducted retrospectively on patients who applied to Bakırköy Sadi Konuk Research and Training Hospital Department of Obstetrics and Gynecology between 2018 and 2023 and were diagnosed with hyperemesis gravidarum. The number of participants was determined with the G*Power (v3.1.9.2) program, taking into account the probability of error (1-β) and having a power of 80%. According to the calculation made taking into account Cohen’s effect size coefficient (d = 0.5), it was decided that there should be at least 96 people in each group, assuming α = 0.01.
Of the total 264 participants, 130 were pregnant women with HEG and 134 were healthy pregnant women without clinical and laboratory findings of HEG. Age, gravida, parity, BMI and laboratory data of the participants in both groups were collected and recorded through the hospital automation system. HEG patients in the study group and healthy pregnant controls were matched in terms of maternal age and gestational age. A combination of different laboratory and demographic criteria was considered for the diagnosis of HEG. HEG was diagnosed in patients with ketonuria accompanied by a loss of more than 5 percent of their pre-pregnancy weight and vomiting more than three times a day. In cases where weight loss was not evident, HEG was diagnosed in the presence of persistent nausea, vomiting, difficulty in feeding, electrolyte imbalance or ketonuria.9 Both groups were compared in terms of demographic characteristics, hematological parameters and inflammation markers. The relationship between ketonuria severity and inflammation markers of patients in the HEG group was also analyzed.
Patients who were between 6 and 20 weeks of gestation, had a singleton pregnancy, had no systemic disease, and were non-smokers were included in the study. Multiple pregnancies, patients with a history of additional obstetric or systemic diseases, patients with a gestational age less than 6 weeks and older than 20 weeks, patients under 18 years of age and over 40 years of age were not included in the study. WBC, NEU, LYM, HB, HCT, PLT, MPV, PDW, PCT and RDW values of the participants in both groups at the time of HEG diagnosis were collected from their digital files. NLO, PLO, and MLO were calculated by dividing the absolute neutrophil count by the absolute lymphocyte count, the absolute platelet count by the absolute lymphocyte count, and the absolute monocyte count by the absolute lymphocyte count, respectively. The presence and severity of ketonuria in the complete urine analysis performed for the diagnosis of HEG (1+, 2+ and 3+ indicate increased severity in ketonuria) were recorded.Ethical ApprovalThis study was approved by the Ethics Committee of Bakırköy Sadi Konuk Research and Training Hospital (Date: 16.09.2023, Decision No:2023-20-12).Statistical AnalysisSPSS 2027 program was used for data analysis. Quantitative variables were presented as mean, standard deviation, median, Q1 and Q3, while qualitative variables were presented as frequency and percentage. Whether the data showed normal distribution was determined by Shapiro Wilks test and Box Plot graphics. Student’s t test or Oneway Anova test was used to evaluate normal variables. The group causing the difference was determined by Bonferroni correction. Mann Whitney U test or Kruskal Wallis test was used to evaluate abnormally distributed variables, and Dunn test was used to determine the group causing the difference. Chi-Square test or Fisher’s Freeman Halton test was used to compare qualitative data. Pearson or Spearman’s correlation was used to analyze the relationships between variables. P < .05 was considered significant within the 95% confidence interval.
Reporting GuidelinesThis study was reported in accordance with the STROBE guideline.
Results
Table 1 shows the demographic characteristics of both groups in detail. Of the total 264 participants, 130 (49.2%) were HEG and 134 (50.8%) were healthy controls. The average age of all participants was found to be 8.67 ± 5.72. BMI, parity, and weight of patients in the HEG group were found to be significantly lower than those of healthy patients (P < .001, P < .003 and P < .001, respectively). Table 2 shows the hematological and cytokine profiles of both groups in detail. HB and hematocrit values of the HEG group were found to be significantly higher than healthy controls (P < .001). The PDW value of the control group was significantly lower than HEG (P < .01). The PDW value of the control group was significantly lower than HEG (P < .01). The MPV values of the participants in the HEG group were found to be significantly lower than the healthy group (P < .01). Urine density was found to be significantly higher in the HEG group compared to controls (P < .01). Table 3 details the distribution of laboratory parameters and inflammation markers according to the severity of ketonuria. NEU value of patients with 1+ ketonuria is significantly lower than patients with 3+ ketonuria (P < .05). The LYM value of patients with 1+ ketonuria was significantly higher than that of patients with 3+ ketonuria (P < .05). The RDW value of patients with 2+ ketonuria was found to be significantly higher than those with 3+ ketonuria (P < .05). NLO values of patients with 1+ ketonuria were significantly lower than those with 3+ ketonuria (P < .01). PLO values of patients with 3+ ketonuria were significantly higher than those with 1+ ketonuria and 2+ ketonuria (P = .005; P = .013; P < .05). MLO measurements of cases with 3+ ketonuria were recorded significantly higher than those with 1+ ketonuria and 2+ ketonuria (P < .003 and P < .014, respectively).
Discussion
Hyperemesis gravidarum is a pregnancy-specific disease that begins in the 6th week of pregnancy, with symptoms peaking at the 13th week of pregnancy and decreasing in severity after the 20th week of pregnancy. Many studies report that HEG is one of the most common causes of hospitalization in the early weeks of pregnancy.2-4 Subclinical inflammation describes the non-infectious increase of cytokines that play a critical role in maintaining intracellular redox balance and protein synthesis. Chronic low-grade subclinical inflammation causes cell damage and worsening of symptoms through a mechanism called inflammatory aging.10 The relationship between ketonuria and proinflammation in HEG has been evaluated in some studies.5,7 Our study, unlike others, is privileged in that it performs subgroup analysis of changes in a larger number of subclinical inflammation markers according to the severity of ketonuria. PCT, MPV, PDW, RDW, MLO, PLO and NLO were used as subclinical inflammation markers. Additionally, the relationship between HB, HCT, WBC, MON, NEU and PLT values and ketonuria severity was analyzed in both groups.
No significant difference was detected in age, height, gestational age and gravity between the two groups. However, parity, BMI, and weight of the HEG group were found to be significantly lower than the control group. The heterogeneity of the groups can be attributed to the retrospective nature of the study. The lower BMI and weight of the HEG group than the controls may be due to feeding difficulty and persistent vomiting. Consistent with our results, in a study comparing HEG and healthy pregnant women, a significant decrease was found in the BMI values of those with HEG during pregnancy compared to the healthy group, although pre-pregnancy BMI values were similar.11 Similarly, we found that HB and hematocrit values of patients diagnosed with HEG were significantly higher than healthy controls. It is thought that the decrease in HB and hematocrit in HEG patients develops as a result of hemoconcentration due to persistent vomiting and insufficient fluid intake.12 No significant change was detected in the number of LYM and RDW between the groups. RDW reflects the change in erythrocyte volume, also referred to as anisocytosis. The study results are heterogeneous in terms of these two parameters.13 High RDW is thought to be related to increased inflammation and oxidative stress.14 PCT is obtained by multiplying the platelet count by MPV and dividing by 10 thousand.15 PCT may be high, low or normal in patients with HEG.16 The fact that the groups were similar in terms of PCT suggests that there is no significant change in the levels of this marker in the early stages of HEG. The similarity of WBC, PLT, NEU and MON between the two groups can be attributed to the fact that demographic and medical parameters such as age, gender, smoking, stress and medications affect the blood levels of these markers.17,18
The fact that no difference was found between the NLO, PLO and MLO measurements of the groups is compatible with some studies in the literature and is inconsistent with others.17,18 The real change in these markers with a single measurement may not be reflected in the clinic. More clear results can be obtained with multiple measurements at different stages of HEG. Ketone measurements in urine have been reported as diagnostic criteria in approximately 60% of clinical studies in the diagnosis of HEG. The most well-known ketone bodies that occur when fats are used for energy are acetoacetate and beta-hydroxybutyric acid. Ketonuria is a good parameter to understand the metabolic consequences of fluid loss and starvation.15-17 We did not detect a relationship between ketonuria and HB, hematocrit, PLT and WBC. Since HB, hematocrit, WBC and PLT values are affected by many factors, a clear correlation between them and the severity of ketonuria may not be detected. NLO measurements of cases with 1+ ketonuria are significantly lower than those with 3+ ketonuria. NLO is calculated by dividing neutrophil and lymphocyte counts. It has been reported that the NLO value is higher in pregnant women diagnosed with HEG than in controls.16,18 Similarly, the calculated PLO and MLO of cases with 3+ ketonuria is significantly higher than those with 1+ and 2+ ketonuria. Many HEG studies support the correlation between ketonuria severity and PLO and MLO.15,16 As a result, the relationship between NLO, MLO and PLO and ketonuria in HEG can be used to monitor the effectiveness of treatment and evaluate the development of complications.
Limitations
The study has some limitations. Although a sufficient number of cases were studied, the retrospective nature of the study is an important limitation. Although subclinical inflammation markers such as MLO, PLO and NLO are associated with the severity of ketonuria, it should not be forgotten that these markers can be affected by many factors related to the patient. These limitations can be overcome with a study design that analyzes the changes of subclinical inflammation markers before, during and after pregnancy.
Conclusion
Evaluation of ketonuria and subclinical inflammation markers during the initial examination of patients diagnosed with hyperemesis gravidarum is important for the management of the disease and metabolic control. Monitoring of subclinical inflammation markers should be done more frequently in HEG patients with ketonuria, as urine ketone values vary depending on the patient’s metabolic state. Close monitoring of these markers will help the clinician in assessing the severity of the disease along with ketonuria and determining the response to treatment.
Declarations
Animal and Human Rights Statement
All procedures performed in this study were in accordance with the ethical standards of the institutional and/or national research committee and with the 1964 Helsinki Declaration and its later amendments or comparable ethical standards.
Informed Consent
Informed consent was waived due to the retrospective nature of the study.
Data Availability
The datasets used and/or analyzed during the current study are not publicly available due to patient privacy reasons but are available from the corresponding author on reasonable request.
Conflict of Interest
The authors declare that there is no conflict of interest.
Funding
None.
Abbreviations
BMI: Body mass index
HB: Hemoglobin
HCT: Hematocrit
HEG: Hyperemesis gravidarum
LYM: Lymphocyte
MLO: Monocyte-to-lymphocyte ratio
MON: Monocyte
MPV: Mean platelet volume
NEU: Neutrophil
NLO: Neutrophil-to-lymphocyte ratio
PCT: Plateletcrit
PDW: Platelet distribution width
PLO: Platelet-to-lymphocyte ratio
PLT: Platelet
RDW: Red cell distribution width
WBC: White blood cell count
References
- American College of Obstetricians and Gynecologists. Practice Bulletin No. 153: nausea and vomiting of pregnancy. Obstet Gynecol. 2015;126(3). doi:10.1097/aog.0000000000001048
- Fejzo MS, Trovik J, Grooten IJ, et al. Nausea and vomiting of pregnancy and hyperemesis gravidarum. Nat Rev Dis Primers. 2019;5(1):62. doi:10.1038/s41572-019-0110-3
- Boelig RC, Barton SJ, Saccone G, Kelly AJ, Edwards SJ, Berghella V. Interventions for treating hyperemesis gravidarum. Cochrane Database Syst Rev. 2016;2016(5). doi:10.1002/14651858.cd010607.pub2
- Fejzo MS, Ingles SA, Wilson M, et al. High prevalence of severe nausea and vomiting of pregnancy and hyperemesis gravidarum among relatives of affected individuals. Eur J Obstet Gynecol Reprod Biol. 2008;141(1):13-17. doi:10.1016/j.ejogrb.2008.07.003
- Soysal C, Işıkalan MM, Bıyık İ, Erten Ö, İnce O. The relationship between inflammation markers and ketonuria in hyperemesis gravidarum. J Obstet Gynaecol Res. 2021;47(9):3078-3083. doi:10.1111/jog.14857
- Beser DM, Oluklu D, Hendem DU, Ayhan SG, Sahin D. The role of systemic immune-inflammation index in the severity of hyperemesis gravidarum. J Gynecol Obstet Hum Reprod. 2023;52(5):102583. doi:10.1016/j.jogoh.2023.102583
- Çintesun E, Akar S, Gul A, et al. Subclinical inflammation markers in hyperemesis gravidarum and ketonuria: a case-control study. J Lab Physicians. 2019;11(2):149-153.
- Yildirim M, Turkyilmaz E, Avsar AF. Preoperative neutrophil to lymphocyte ratio has a better predictive capacity in diagnosing tubo-ovarian abscess. Gynecol Obstet Invest. 2015;80(4):234-239. doi:10.1159/000371762
- Jansen LAW, Koot MH, Van't Hooft J, et al. The Windsor definition for hyperemesis gravidarum: a multistakeholder international consensus definition. Eur J Obstet Gynecol Reprod Biol. 2021;266:15-22. doi:10.1016/j.ejogrb.2021.09.004
- Fulop T, Larbi A, Pawelec G, et al. Immunology of aging: the birth of inflammaging. Clin Rev Allergy Immunol. 2023;64(2):109-122.
- Kosus A, Eser A, Kosus N, Usluogullari B, Hizli D. Hyperemesis gravidarum and its relation with maternal body fat composition. J Obstet Gynaecol. 2016;36(6):822-826. doi:10.3109/01443615.2016.1157153
- Sari N, Ede H, Engin-Ustun Y, Göçmen AY, Çağlayan EK. Hyperemesis gravidarum is associated with increased maternal serum ischemia-modified albumin. J Perinat Med. 2017;45(4):421-425. doi:10.1515/jpm-2015-0421
- Tayfur C, Burcu DC, Gulten O, et al. Association between platelet to lymphocyte ratio, plateletcrit and the presence and severity of hyperemesis gravidarum. J Obstet Gynaecol Res. 2017;43(3):498-504. doi:10.1111/jog.13228
- Wen Y. High red blood cell distribution width is closely associated with risk of carotid artery atherosclerosis in patients with hypertension. Exp Clin Cardiol. 2010;15(3):37-40.
- Beyazit F, Öztürk FH, Pek E, Ünsal MA. Evaluation of the hematologic system as a marker of subclinical inflammation in hyperemesis gravidarum: a case-control study. Ginekol Pol. 2017;88(6):315-319. doi:10.5603/gp.a2017.0059
- Adibi P, Faghih Imani E, Talaei M, Ghanei M. Population-based platelet reference values for an Iranian population. Int J Lab Hematol. 2007;29(3):195-199. doi:10.1111/j.1751-553x.2006.00843.x
- Emekçi Özay Ö, Özay AC. Inflammatory markers in hyperemesis gravidarum. Arch Med Res. 2021;37(1):27-31. doi:10.4274/eamr.galenos.2020.32448
- Ross MG, Sherman DJ, Ervin MG, Castro R, Humme J. Maternal dehydration-rehydration: fetal plasma and urinary responses. Am J Physiol Endocrinol Metab. 1988;255(5). doi:10.1152/ajpendo.1988.255.5.e674
Tables
Table 1. Comparison of Demographic Data by Groups
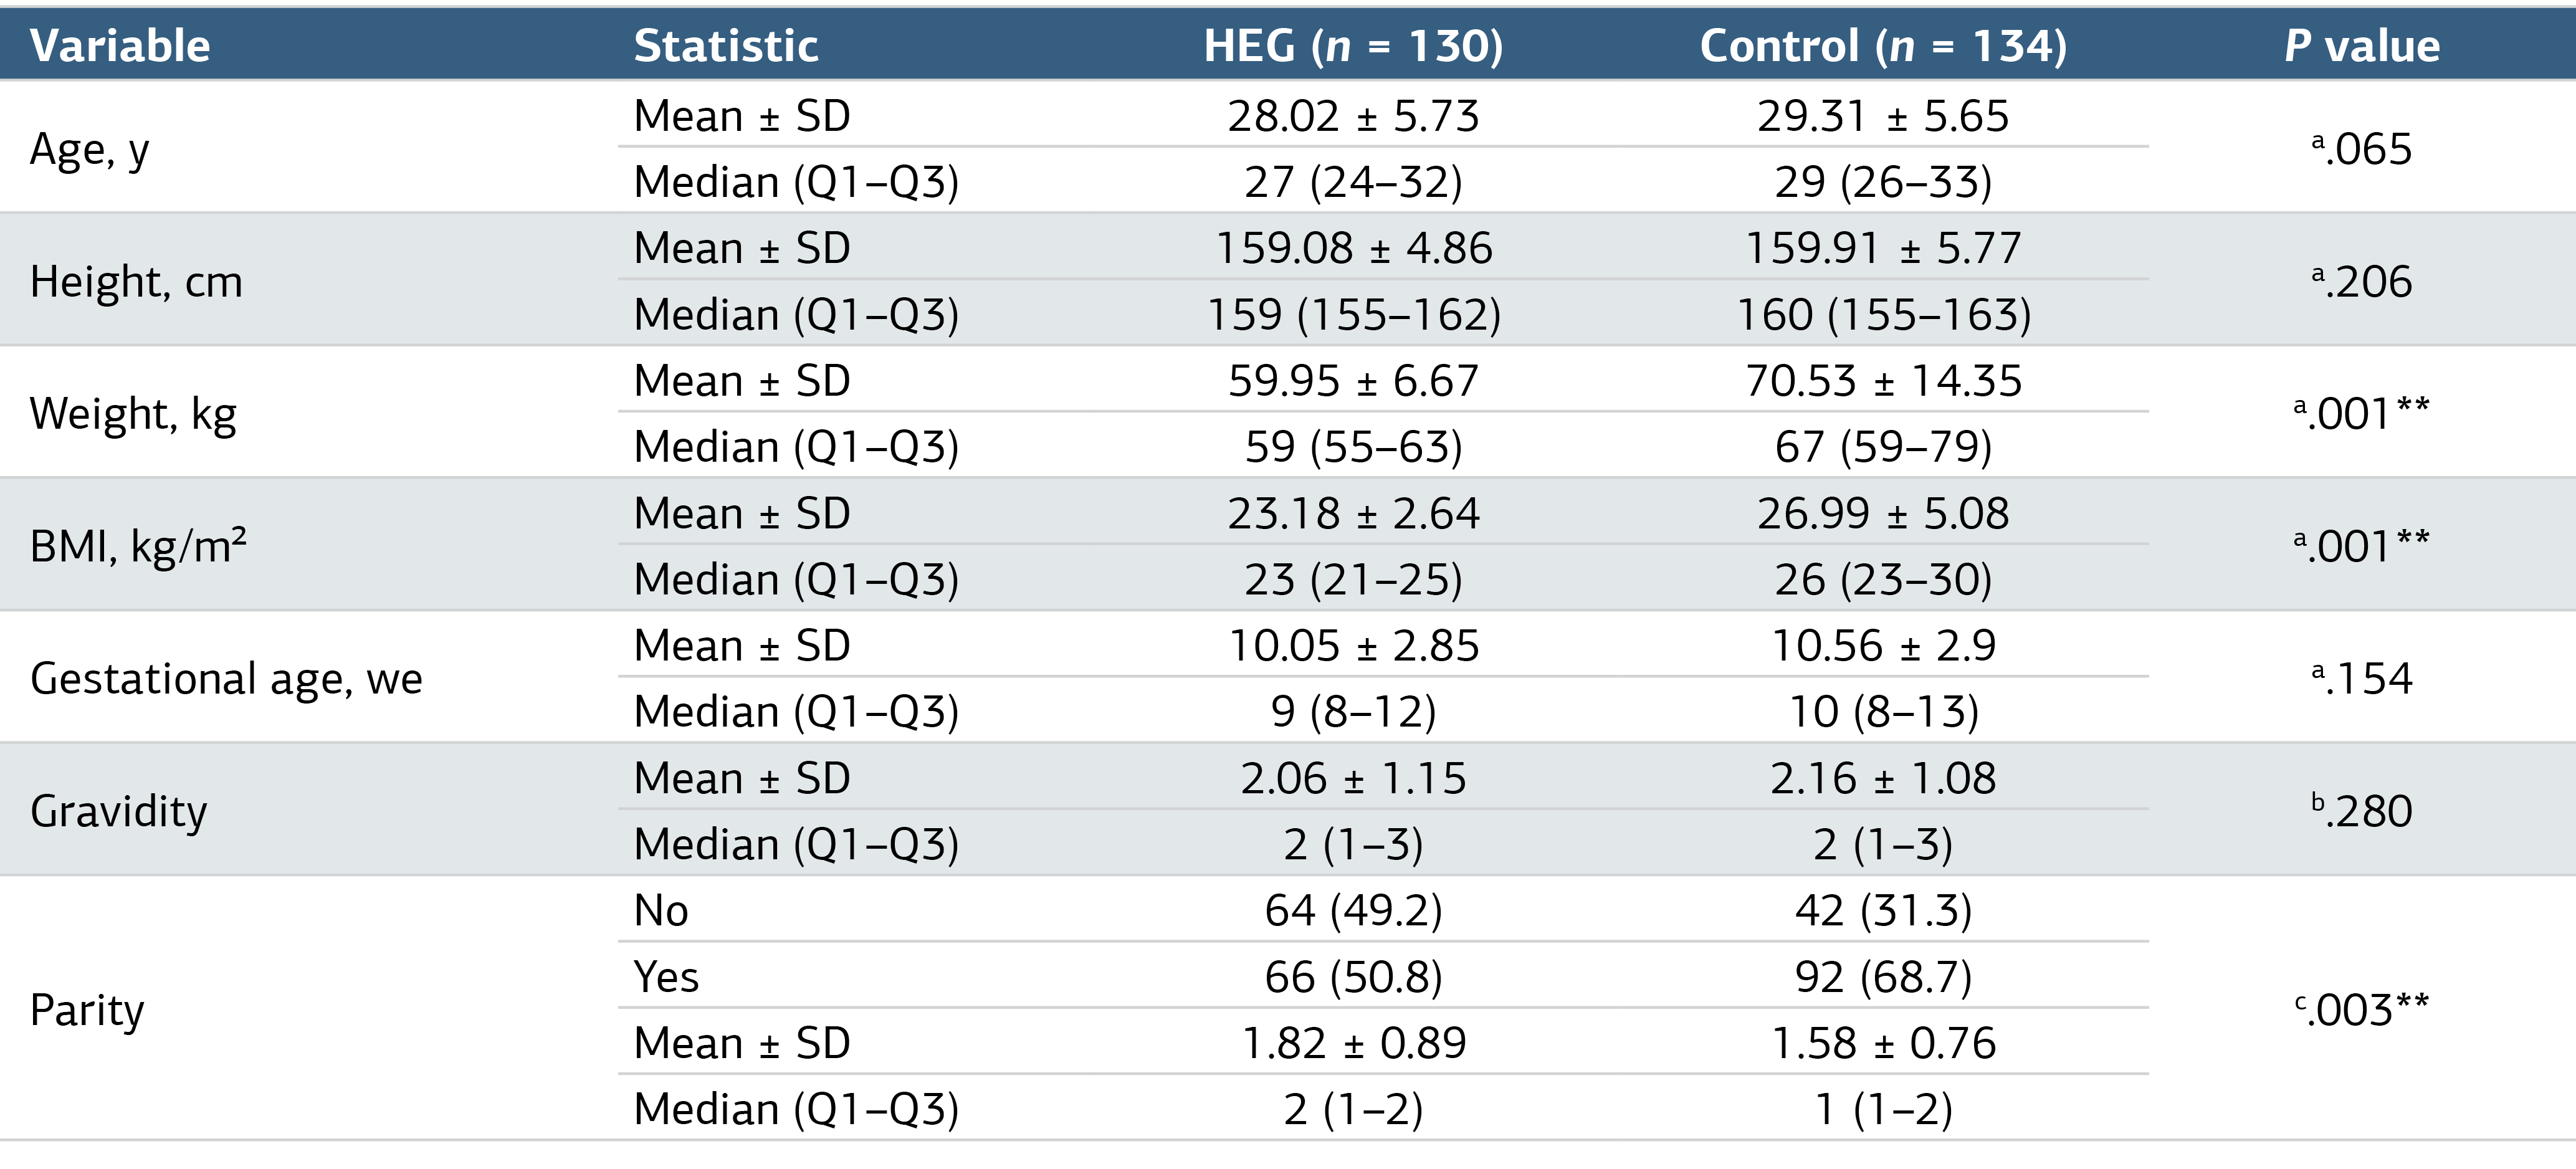
a, Student-t Test; b, Mann-Whitney-U Test; c, Pearson Chi-Square; d, Fisher Freeman Halton Test; **P < .001,01.
Table 2. Comparison of Pro-Inflammatory Markers and Hematological Parameters by Groups
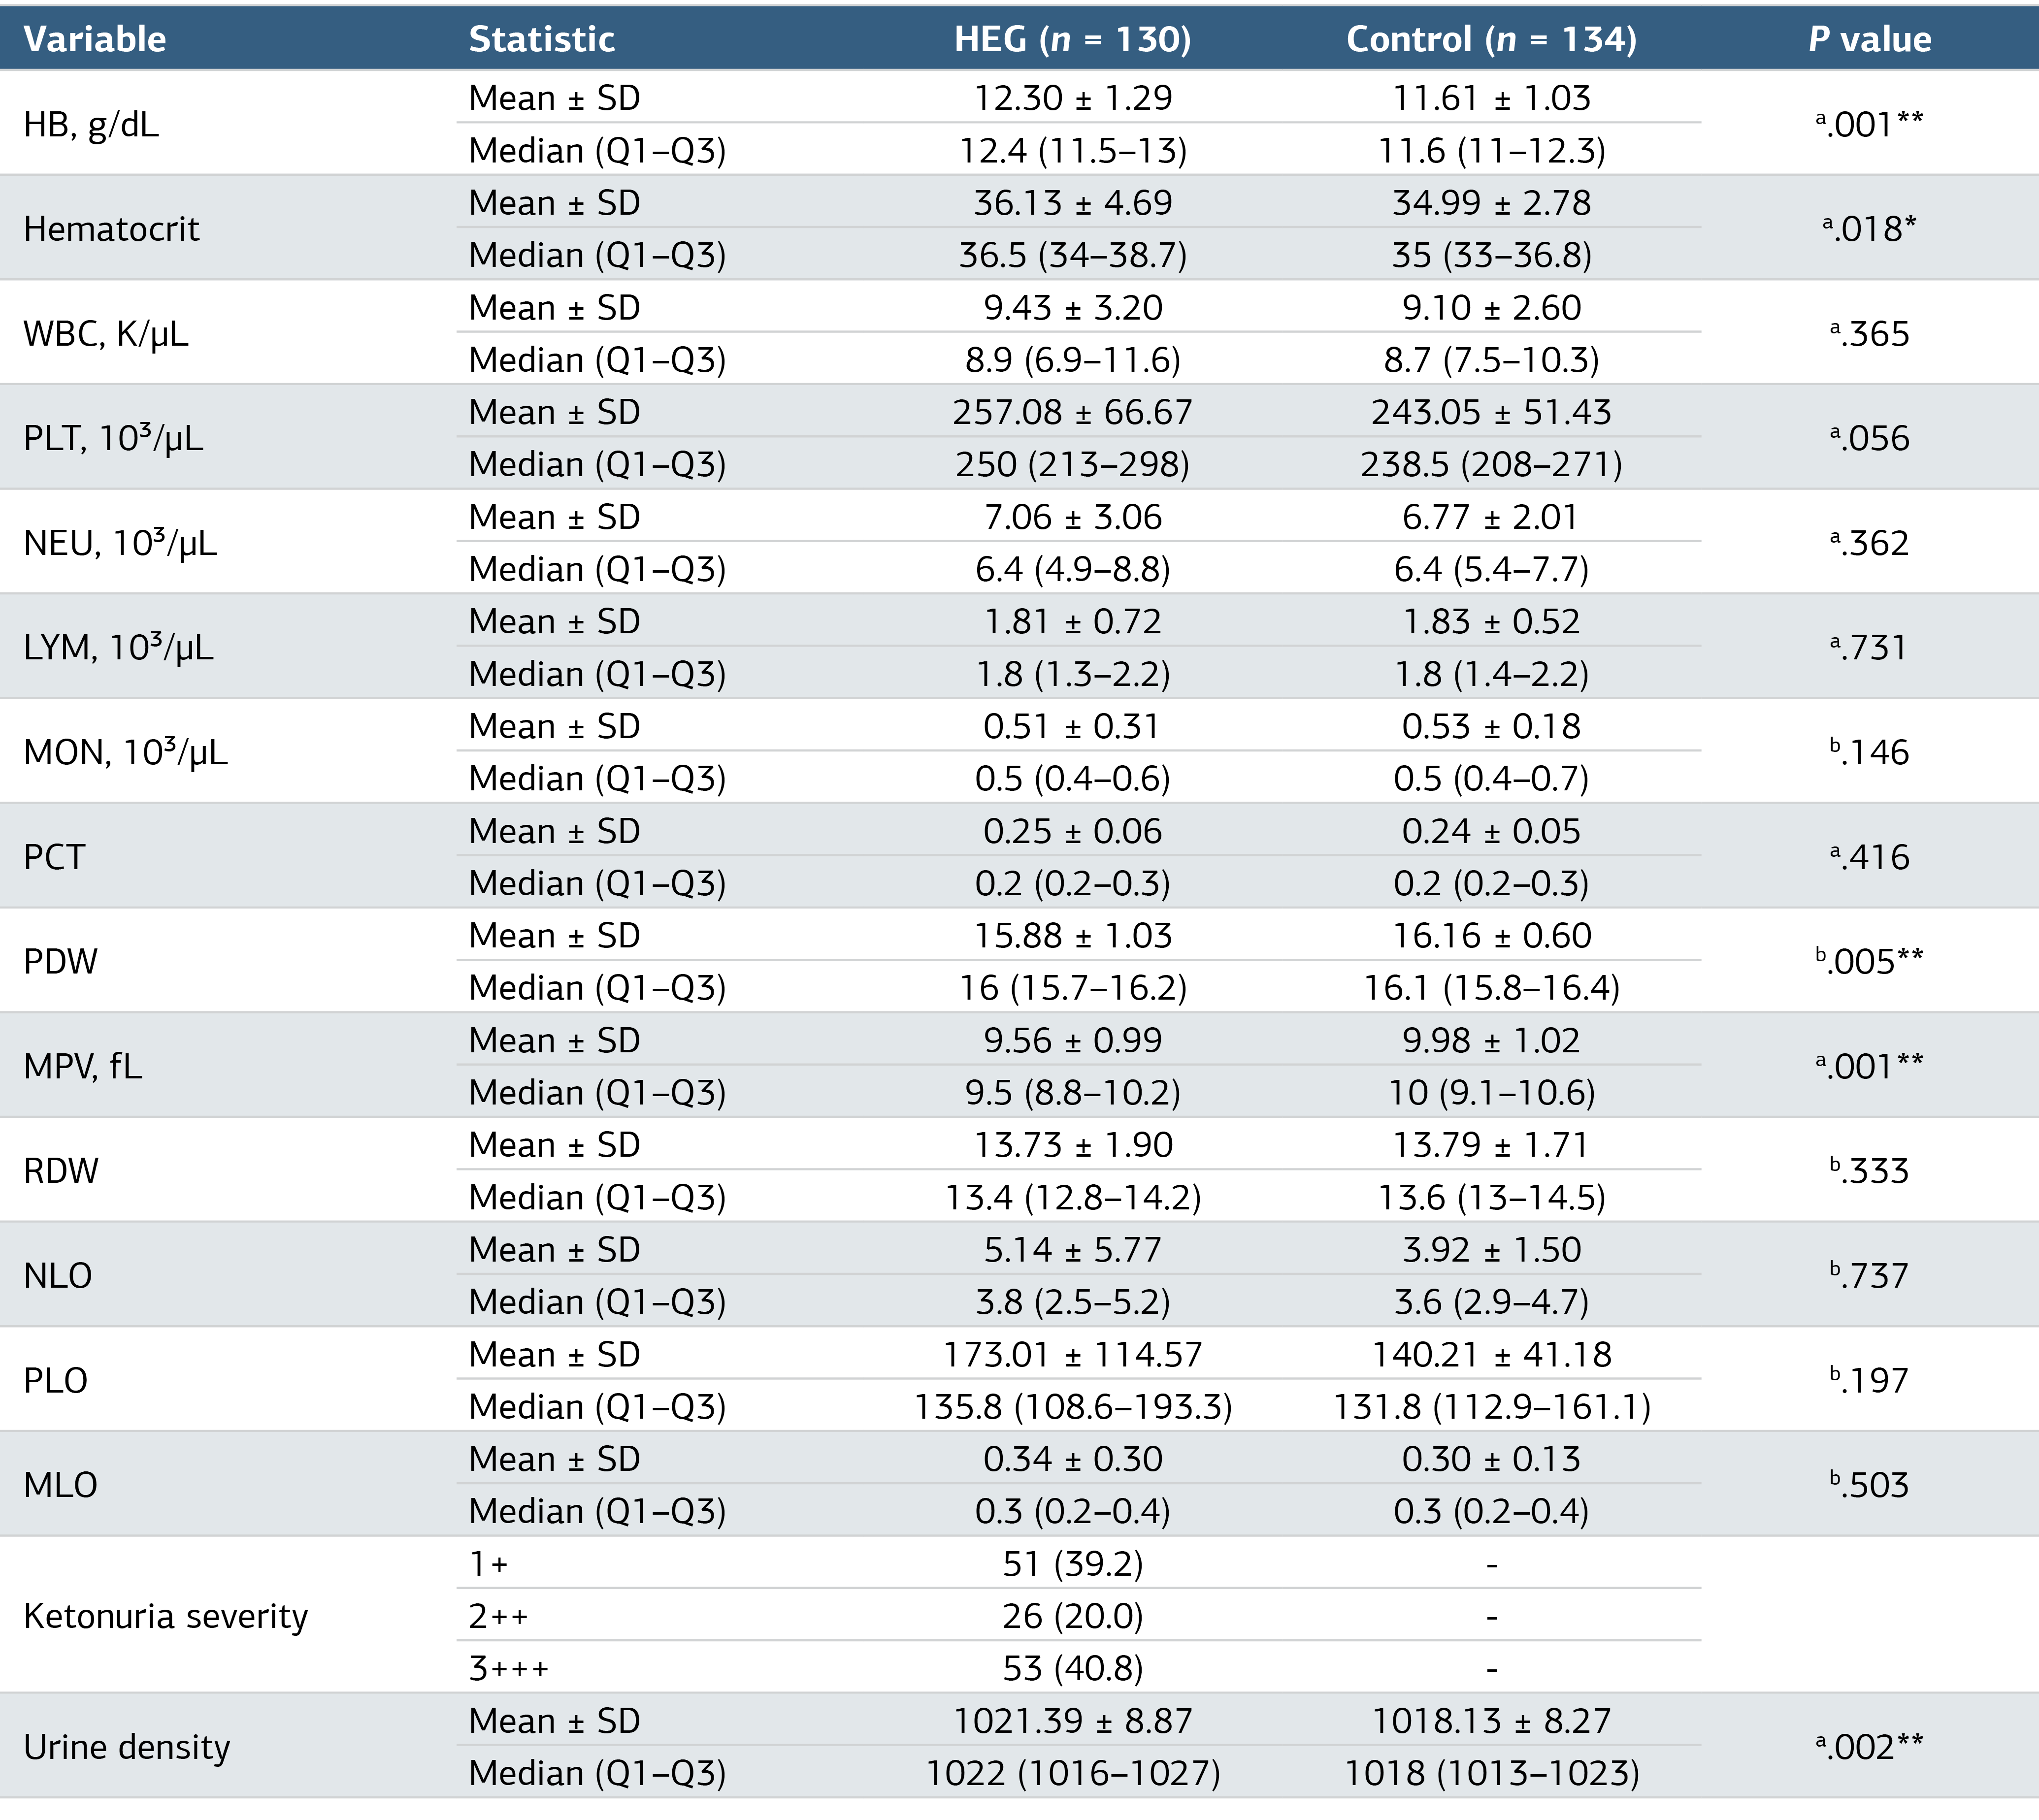
a, Student-t Test; b, Mann-Whitney-U Test **P < .001,01 *P < .001,05.
Table 3. Laboratory Parameters and Inflammation Markers According to Ketonuria Severity
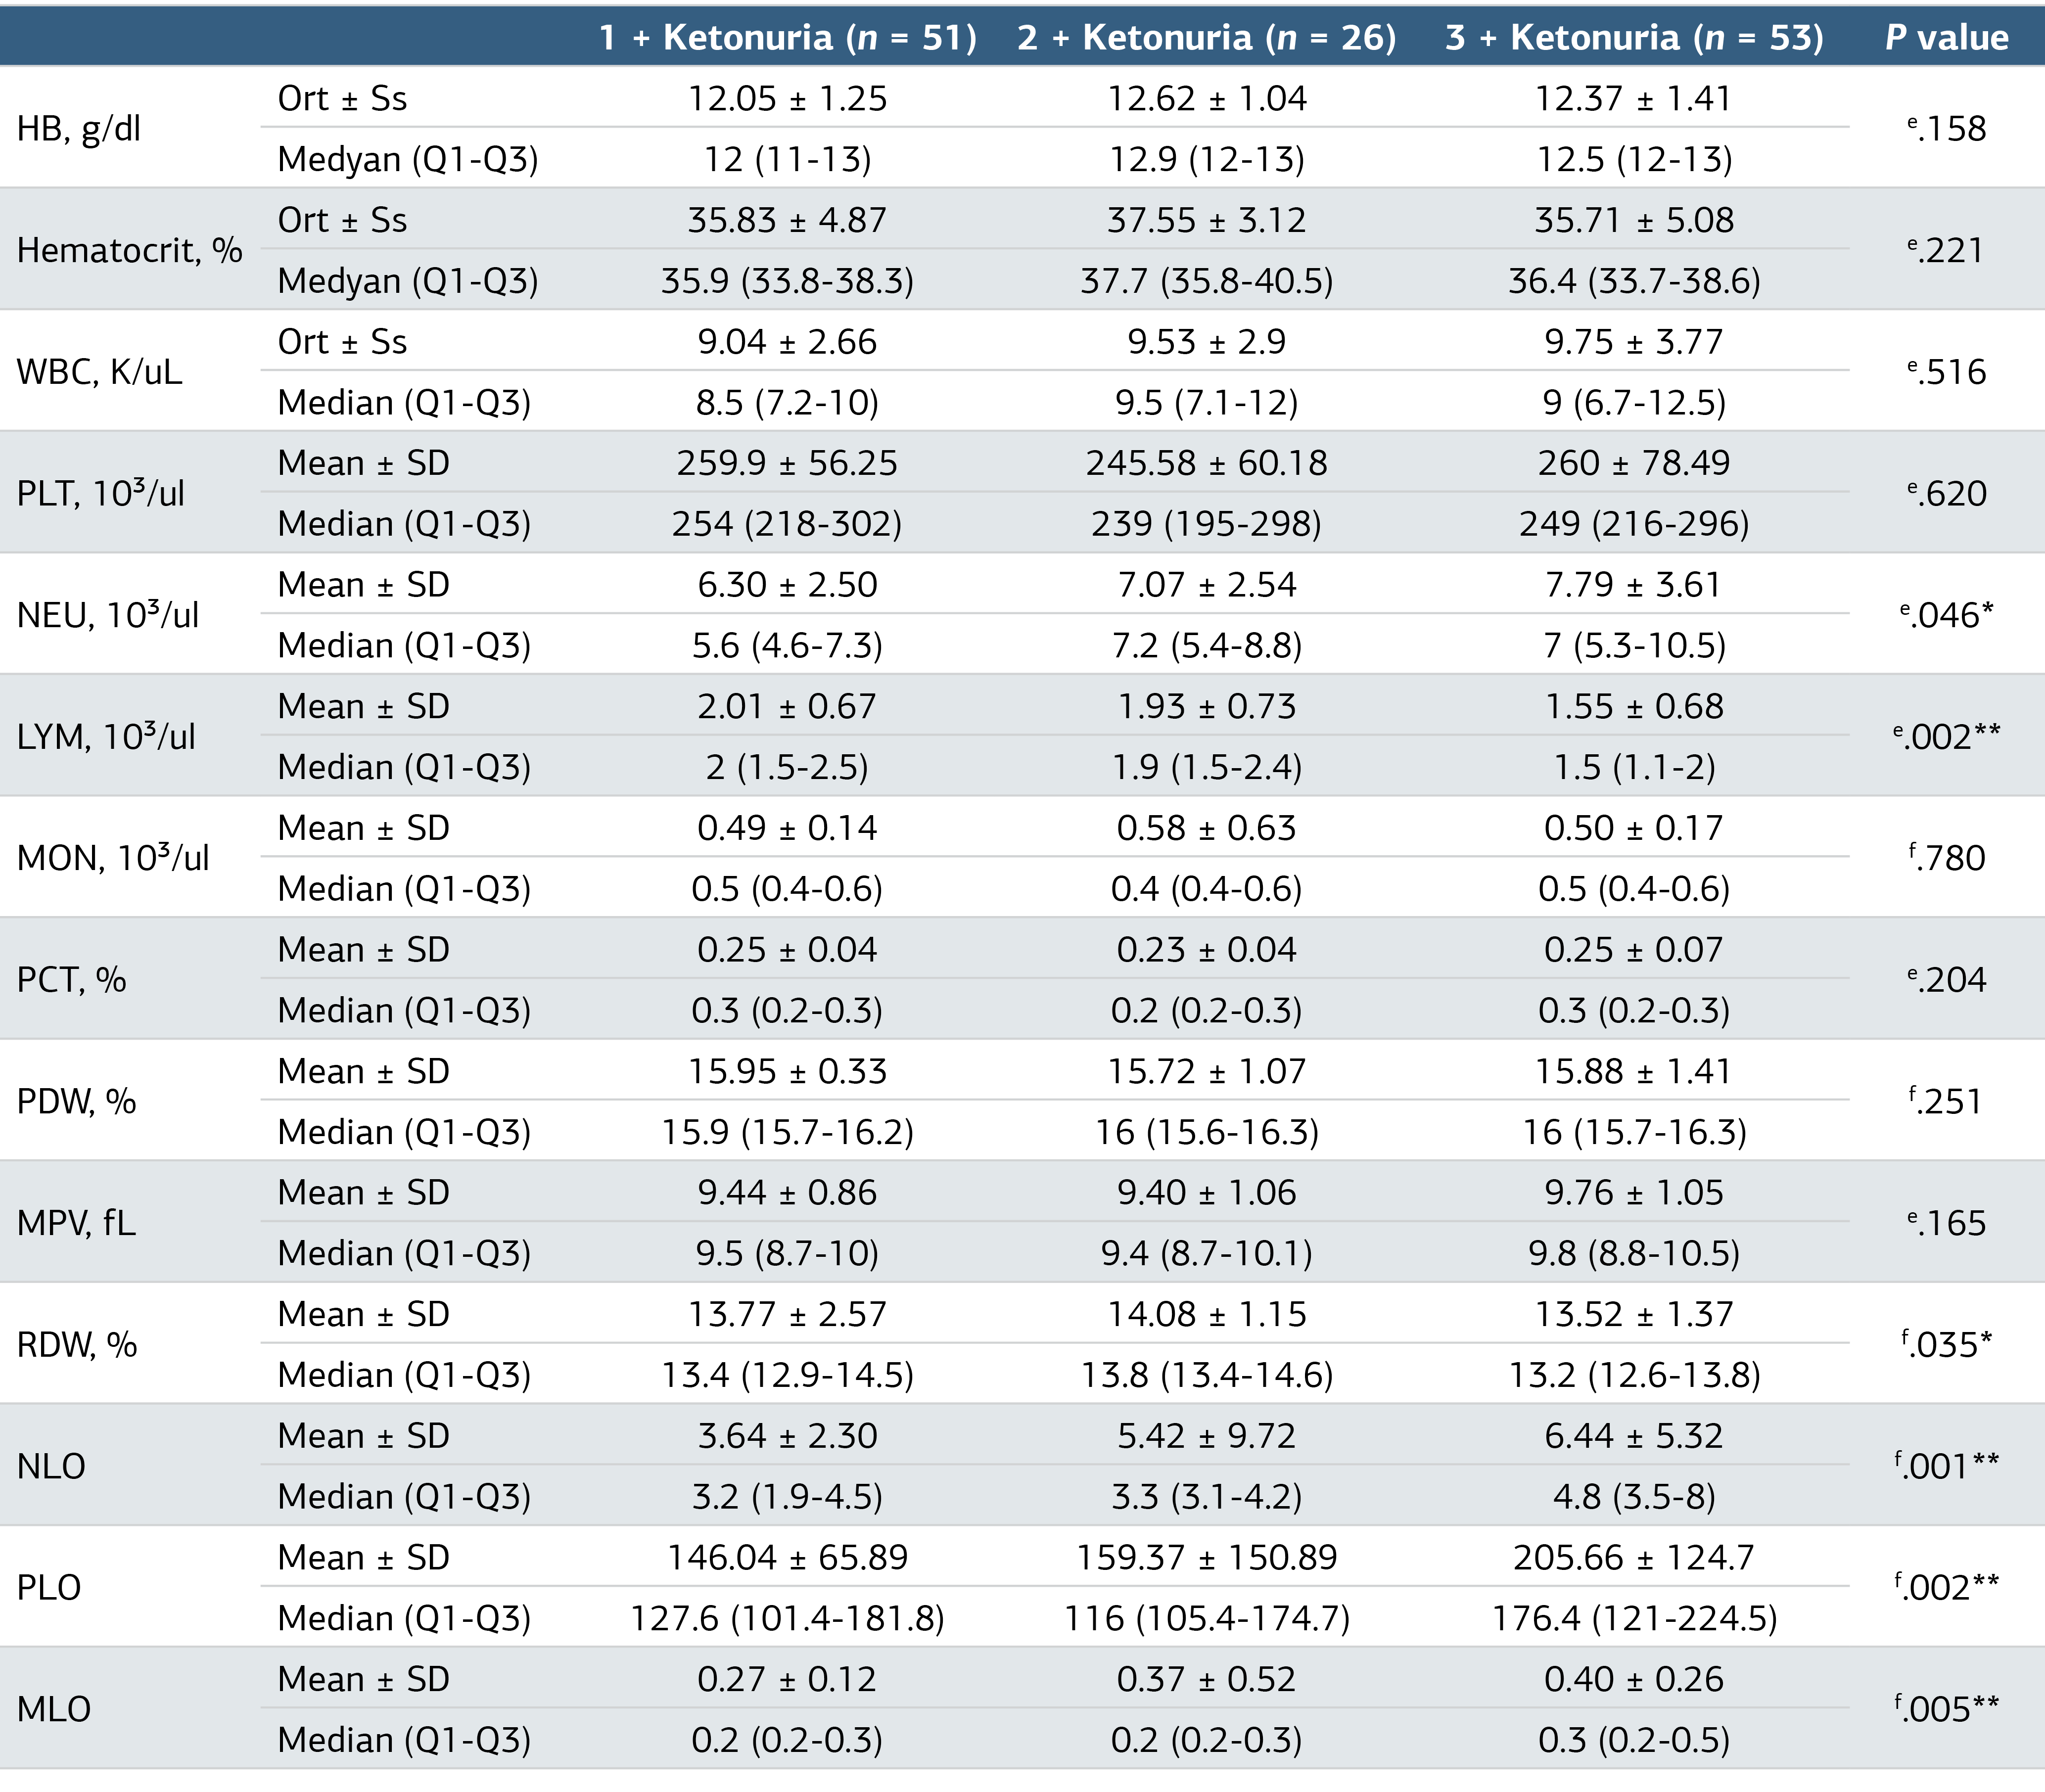
e, One Way Anova Test & Bonferroni Test; f, Kruskal Wallis Test & Dunn-Bonferroni Test; *P < .001,05 **P < .001,01.
Additional Information
Publisher’s Note
Bayrakol MP remains neutral with regard to jurisdictional and institutional claims.
Rights and Permissions

This work is licensed under a Creative Commons Attribution-NonCommercial 4.0 International License (CC BY-NC 4.0). To view a copy of the license, visit https://creativecommons.org/licenses/by-nc/4.0/
About This Article
How to Cite This Article
Yiğit Mert Bayrak, Ramazan Özyurt, Levent Yaşar. Evaluation of the relationship between subclinical inflammation markers and ketonuria in hyperemesis gravidarum. Ann Clin Anal Med 2024;15(11):774-779. doi:10.4328/ACAM.22251
Publication History
- Received:
- 07.05.2024
- Accepted:
- 12.06.2024
- Published Online:
- 13.09.2024
- Printed:
- 01.11.2024