
Exploring muscle and fat composition differences in acute appendicitis
Exploring muscle and fat composition differences in acute appendicitis
Authors
Abstract
AimThis study aimed to examine skeletal muscle and fat composition in patients with appendicitis, comparing cases with perforation to those without.
MethodsThis retrospective observational study involved analyzing portal venous phase CT scans for patients diagnosed with acute appendicitis between April 2022 and April 2023. A total of 106 patients were included.
The Skeletal Muscle Index (SMI), Visceral Fat Index (VFI), Visceral to Subcutaneous Fat Ratio (VSR), Skeletal Muscle Mass to Visceral Fat Area Ratio (SVR), and Intramuscular Adipose Tissue Content (IMAC) were measured individually for both female and male participants.
ResultsThe study included 50.9% female patients (n = 54) and 49.0% male patients (n = 52). The perforated group comprised 51% of patients (n = 55), while the non-perforated group comprised 48% of patients (n = 51). The age and sex distributions were comparable between the perforated and non-perforated groups (p=0.776 and p=0.994). Among the females, the SMI median value was significantly higher in the group with perforation (37.2 cm²/m²) compared to non-perforated group (33.1 cm²/m²) (p=0.011). Among males the median SMI values did not show a significant difference between the perforated group (51.0 cm²/m²) and the non-perforated group (49,0 cm²/m²). The values for VSR, SVR, VFI, and IMAC displayed no significant differences between the two groups for both female and male participants (p>0.05).
ConclusionThe higher SMI values in the perforated group among females challenge preconceptions and highlight the multifaceted nature of factors influencing appendiceal perforation. Additional studies are necessary to clarify the intricate relationships between body composition, gender-specific factors, and the progression of acute appendicitis.
Keywords
Introduction
Acute appendicitis (AA) is a globally recognized surgical emergency, occurring at a range of 96.5 to 100 cases per 100,000 adults annually.1 Recent research points to possible differences in the underlying mechanisms between perforated appendicitis (pAA) and non-perforated appendicitis (npAA).2,3,4 Although the rate of pAA has remained constant in recent years, changes in the incidence of npAA suggest potential independent disease mechanisms.2,3 It has been proposed that complicated and uncomplicated appendicitis may represent distinct immunological conditions.4
Even with advancements in diagnostic and management techniques, the causes and risk factors for perforation are still not well understood. Understanding the urgency of perforation and identifying reliable indicators for recovery and adverse outcomes remains a critical knowledge gap.4 Existing research predominantly explores the risk factors for pA, such as male gender, older age, BMI, elevated laboratory values, and pre-hospital delay.5,6,7,8,9 Despite this, there has been little focus on the connection between perforation and the analysis of muscle and fat composition analyses, with just one study addressing it.10
Decreased muscle status and elevated intramuscular fat tissue are associated with negative health outcomes, increased morbidity, and heightened mortality.11,12 Skeletal muscle and adipose tissue are now understood to function as secretory organs, releasing pro-inflammatory and anti-inflammatory cytokines and adipokines, which influence various physiological processes.13
A range of diagnostic tools is now available for assessing sarcopenia, and computed tomography (CT) is considered the gold standard.14 CT offers the benefit of evaluating both the quantity and quality of muscle . In CT scans, the Skeletal Muscle Area (SMA) is quantified on a single slice and adjusted based on an individual’s height, resulting in the Skeletal Muscle Index (SMI). CT enables the assessment of myosteatosis, indicating the presence of fat within the muscle, by measuring the muscle density. A lower radiodensity in CT images signifies higher fat content in the muscle.15 In addition, CT allows the measurement of subcutaneous and visceral fat areas on a single imaging slice. This study seeks to address this gap by utilizing CT to accurately assess skeletal muscle and fat composition, with the goal of identifying differences between perforated and non-perforated appendicitis.
Materials and Methods
PatientsWe screened adult patients who underwent contrast-enhanced abdominal CT between April 2022 and April 2023, to identify those diagnosed with acute appendicitis. Patients with acute appendicitis-like reactive changes were excluded from this study. Pediatric patients, those with recent surgeries, and individuals with missing personal information were also excluded (Figure 1).
The final study cohort comprised 55 patients with pAA and 51 with npAA. We retrospectively gathered patient details, such as sex, age, and height from the patient information system.
CT ScanCT scans were conducted using a GE Revolution EVO 128-slice multi-detector scanner. The imaging protocol included a 2 mm collimation, 2 mm section thickness, rotation time of 0.6 seconds, pitch of 1, FOV of 40 cm, kV of 120, and mA ranging from 200 to 400. The imaging was performed during the portal venous phase, 65 seconds after the after administration of contrast material.
CT Interpretation and MeasurementsCT analysis was conducted using the Advantage Workstation 4.7 Revolution software from GE, USA, available at our hospital’s radiology workstations. CT images were meticulously examined for 8 informative features associated with perforated appendicitis. These features include appendiceal diameter, extraluminal appendicolith, abscess, appendiceal wall enhancement defect, extraluminal air, peri-appendiceal fluid collection, intraluminal air, and moderate or severe peri appendiceal fat stranding.16,17 Based on these features, the patients were classified as perforated and non-perforated, according to a consensus formed by abdominal radiologists with two to ten years of experience.
All CT muscle and fat measurements were performed by a radiologist within 5 years of experience and one of our experienced radiologists. The measurements of the experienced radiologist were considered as the standard to establish other parameters.
First, the L3 vertebral level was marked in the sagittal plane. The skeletal muscles at this level (rectus abdominis, lateral and oblique abdominal muscles, psoas major, quadratus lumborum, erector spinae, and multifidus muscles) were evaluated in a single section. To isolate the muscle structures, the -29 to 150 Hounsfield Unit (HU) range was chosen by manually outlining defined patients (Figure 2).18 The Skeletal Muscle Area (SMA) was quantified in square centimeters (cm²), within the specified density range, on a single section at the L3 vertebral level (Figure 2). To normalize SMA, it was proportioned to the square of the patient’s height, and the Skeletal Muscle Index (SMI) was obtained in cm²/m². SMI was evaluated as a continuous variable and served as an indicator of whole-body muscle mass. This approach is consistent with a study that demonstrating a linear relationship between the total skeletal muscle cross-sectional area at the L3 vertebra level and whole-body muscle mass.19 To assess visceral and subcutaneous adipose tissue areas at the same level, we defined limits by selecting HU values of -190 to -30 for subcutaneous fat and -150 to -50 for visceral fat (Figure 2).18,20 We calculated the Visceral to Subcutaneous Fat Ratio (VSR) by dividing the Visceral Adipose Tissue area (VAT) by the area of Subcutaneous Adipose Tissue (SAT). To normalize the VAT, it was proportioned to the square of the patient’s height, and the Visceral Fat Index (VFI) was obtained in cm²/m². VFI was evaluated as a continuous variable and used as an indicator of whole-body visceral fat. To compare patients’ muscle and fat ratios, we investigated the Skeletal Muscle to Visceral Fat Ratio (SVR).21 SVR was calculated by dividing SMA by VAT.
We employed sex-specific thresholds for sarcopenia that were strongly linked to mortality in solid tumor patients, as established by Prado and colleagues in 2021.22 These thresholds were determined as 52.4 cm²/m² for men and 38.5 cm²/m² for women.22
We also assessed the muscle quality using a measure called Intramuscular Adipose Tissue Content (IMAC) at the L3 level. The IMAC was calculated by dividing the HU values of the erector spinae muscles by the HU value of subcutaneous fat at the L3 level (Figure 3). A higher IMAC suggests more fat in the muscles, indicating a lower muscle quality.23
Ethical ApprovalThis study was approved by the Ethics Committee of the Ankara Bilkent City Hospital (Date: 23.08.2023, Decision No: E2-23-4772).
Statistical AnalysisThe study’s statistical analyses and evaluation were conducted using IBM Statistical Package for the Social Sciences for Windows, version 26.0 (SPSS Inc.). We calculated descriptive statistics for age, sex, and appendicitis status. Additionally, we performed CT muscle and fat analyses, such as SMI, VSR, IMAC, SVR, and VFI for both female and male groups.
Normality was tested using the Kolmogorov-Smirnov test; non-normally distributed data were reported as median (IQR). Categorical data were analyzed using the Chi-square test, whereas non-parametric data were assessed with the Mann-Whitney U test. Intraclass correlation coefficients (ICC) were calculated to assess interobserver agreement (with corresponding 95% confidence intervals) for the SMA, SAT, and VAT. An ICC less than 0.5 was interpreted as “poor,” 0.5–0.74 as “moderate,” 0.75–0.89 as “good,” and 0.90 or greater as “perfect” in terms of reliability. A p-value of less than 0.05 was considered statistically significant.
Reporting GuidelinesThe study was reported in accordance with STROBE guidelines.
Results
A total of 106 patients were involved in this study with 50.9% being female (n = 54) and 49.0% male (n = 52). The comorbidities of the patients in both groups are presented in Table 1. The perforated group comprised 51% of the patients (n = 55), while the non-perforated group comprised 48% of the patients (n = 51) (Table 1, Table 2). The gender distribution showed no statistical difference, with females comprising 50.9% (28/55) of perforated cases and 60% (26 / 51) of non-perforated cases (p=0.776). Age distributions were similar in both groups (p=0.994) (Table 2).
Among the females, the median SMI value was significantly higher in the group with perforation (37,2 cm²/m²) than in the group without perforation (33,1 cm²/m²) (p=0.011) (Table 3). However, no statistical difference was observed between the perforated group (51.0 cm²/m²) and the non-perforated group (49.0 cm²/m²) in SMI median values among men (p=0.101) (Table 3).
VSR, SVR, VFI, and IMAC values were not significantly different between the two groups for both females and males (Table 3). Based on SMI values, the sarcopenia rate in women in the nonperforated group (84%) was significantly higher than in women from perforated group (57%) (p=0.027).
However, there was no significant difference in the sarcopenia rate between men in the perforated (55.5%) and those in the non-perforated group (64.0%) (p=0.535).
In the ROC Curve analysis for SMI values of female patients, 35.0 cm²/m² was identified as the cut-off point with a 95% confidence interval (AUC = 0.701 (0.561-0.841), sensitivity = 60.7%, specificity = 61.5%, p=0.011). No statistically significant results were found in the ROC Curve analysis of other parameters of female patients (p>0.05).
No statistically significant results were found in the ROC curve analysis for the parameters mentioned above in male patients (p>0.05).
SMA, SAT, VAT, and IMAC measurements were independently conducted by a less experienced radiologist (5 years of experience) and an experienced radiologist (10 years of experience) in a blinded manner. The ICC and 95% confidence intervals for the interobserver agreements were mostly good: SMA, 0.85 (0.71–0.94); SAT, 0.88 (0.79–0.91); VAT, 0.85 (0.72– 0.93); and IMAC, 0.86 (0.77–0.93).
Discussion
We aimed at investigating the differences in skeletal muscle and fat composition between patients with perforated and nonperforated acute appendicitis using CT analysis. Our results illuminate the intricate relationship between body composition and the development of appendiceal perforation.
Among the key findings of this study was the significantly higher Skeletal Muscle Index (SMI) values among females in the perforated group compared (37.2 cm²/m²) to the non-perforated group (33.1 cm²/m²) (p=0.011). This intriguing finding likely contrasts with the sole article we found on this subject in the literature. They proposed that a “reduction in muscle area and the identification of sarcopenia through computed tomography (CT) are indicative of increased susceptibility to complicated appendicitis”.10 However, as they stated, working only with the elderly population may lead to a difference, that could explain this discrepancy with our study findings. Additionally, in our study, we evaluated SMI and other data separately between men and women, which may have caused this difference.
Interestingly, no statistical difference was detected between the perforated group (51.0 cm²/m²) and the non-perforated group (49.0 cm²/m²) in SMI median values among men (p=0.101). This gender disparity highlights the potential influence of sex-specific factors on the relationship between muscle composition and appendiceal perforation. Our findings underscore the importance of conducting further research to clarify the intricate connections between sex, muscle composition, and the pathogenesis of appendiceal perforation. No significant difference was identified in CT fat values, such as VSR, VFI, and SVR, between the two groups. Based on the ability of adipose tissue to secrete pro-inflammatory adipokines and various other pro-inflammatory factors, we anticipated differences between the appendicitis groups.13,24 We aimed to determine whether the inflammatory response leading to perforation in appendicitis is closely linked to the balance between visceral and subcutaneous fat and the overall visceral fat content. To our knowledge, no prior studies have directly investigated this aspect of the pathophysiology of appendicitis. While previous studies have suggested associations between Body Mass Index (BMI) and anorexia with perforated appendicitis, the available literature presents conflicting perspectives. For instance, one study observed a lower BMI in patients with perforated appendicitis, particularly in the geriatric population.10 while another highlighted anorexia as a significant factor associated with perforation in geriatric patients.5 Intriguingly, a study without age limitations reported contrasting findings, indicating a higher BMI in patients with perforated appendicitis.9 We attribute the differing results of these studies to their use of different populations and concepts such as BMI and anorexia, which affect both fat and muscle mass together. For this reason, we performed this comparison using more quantitative ratios. The absence of significant differences in VSR, SVR, and VFI between the two groups underscores the necessity for a paradigm shift in the understanding of the nuanced relationship between adipose tissues and the course of appendicitis.
We did not observe any age or sex differences between the groups. Earlier studies have indicated that older age may be linked to a higher risk of perforation.6,7 Pokharel et al. proposed that in elderly patients, complications, such as perforation, are more likely due to vascular sclerosis, lumen narrowing, and fat infiltration in the appendix’s muscle layer.25 According to another study, there was apparently no association between age and perforation.9 When it comes to gender, some studies suggest that being male is associated with the risk of perforation.5,7 However, alternative perspectives suggest that there is no correlation between sex and the occurrence of perforation.8,9 Considering our hospital’s status as a tertiary care center, it should be noted that perforated cases were more prevalent than non-perforated cases. This discrepancy may have implications related to both age and sex, suggesting potential influences of these demographic factors.
We used IMAC to assess muscle quality and found no significant group differences (p>0.05). To measure IMAC, we sought to minimize the contrast enhancement effect in the contrast-enhanced scans by calculating the ratio of HU values in the erector spinal muscles to those in the adjacent fat planes. Nevertheless, we acknowledge that IMAC measurements are more accurate in non-contrast scans.15
Limitations
Our study is the first to compare the CT muscle and fat analysis of perforated and non-perforated appendicitis in the general adult population among males and females. However, this study has some limitations. We recognize that the radiological features we used for distinguishing between perforated and non-perforated appendicitis demonstrate high specificity but limited sensitivity on an could individual basis.16,17 Because of the retrospective nature of our we could not determine the exact time in hours between the onset of patients’ symptoms and their CT scan. Our study concentrated on analyzing muscle and fat using CT scans. Other major relevant variables that may affect the perforation, such as the presence of fecalith, the morphology of the appendix vermiformis, patient immunologic status, and other possible risk factors were not considered. Future studies should utilize a multicenter prospective design to improve the generalizability of findings across diverse populations, minimize potential biases inherent in our retrospective single-center study. Despite these limitations, our findings should be confirmed with multivariate logistic regression analyses.
Conclusion
In summary, this study offers important insights into how muscle and fat composition relate to the risk of appendiceal perforation. The surprising discovery of higher SMI values in the perforated group among females challenges preconceptions and underscores the complex nature of contributing factors influencing appendiceal perforation. Additional studies are required to clarify the complex interplay between body composition, sex-specific factors, and the course of acute appendicitis.
Declarations
Animal and Human Rights Statement
All procedures performed in this study were in accordance with the ethical standards of the institutional and/or national research committee and with the 1964 Helsinki Declaration and its later amendments or comparable ethical standards.
Informed Consent
Informed consent was waived due to the retrospective design of the study.
Data Availability
The datasets used and/or analyzed during the current study are not publicly available due to patient privacy reasons but are available from the corresponding author on reasonable request.
Conflict of Interest
The authors declare that there is no conflict of interest.
Funding
None.
Abbreviations
AA: Acute appendicitis
AUC: Area under the curve
BMI: Body mass index
CT: Computed tomography
HU: Hounsfield unit
ICC: Intraclass correlation coefficient
IMAC: Intramuscular adipose tissue content
IQR: Interquartile range
npAA: Non-perforated appendicitis
pAA: Perforated appendicitis
SAT: Subcutaneous adipose tissue
SMA: Skeletal muscle area
SMI: Skeletal muscle index
SVR: Skeletal muscle to visceral fat ratio
VAT: Visceral adipose tissue
VFI: Visceral fat index
VSR: Visceral to subcutaneous fat ratio
References
-
Moris D, Paulson EK, Pappas TN. Diagnosis and management of acute appendicitis in adults: a review. JAMA. 2021;326(22):2299-2311. doi:10.1001/jama.2021.20502
-
Bhangu A, Søreide K, Di Saverio S, Assarsson JH, Drake FT. Acute appendicitis: modern understanding of pathogenesis, diagnosis, and management. Lancet. 2017;390(10104):1736.
-
Livingston EH, Woodward WA, Sarosi GA, Haley RW. Disconnect between incidence of nonperforated and perforated appendicitis: implications for pathophysiology and management. Ann Surg. 2007;245(6):886-892. doi:10.1097/01.sla.0000256391.05233.aa
-
Salö M, Gudjonsdottir J, Omling E, Hagander L, Stenström P. Association of IgE-mediated allergy with risk of complicated appendicitis in a pediatric population. JAMA Pediatr. 2018;172(10):943-948. doi:10.1001/jamapediatrics.2018.1634
-
Sirikurnpiboon S, Amornpornchareon S. Factors associated with perforated appendicitis in elderly patients in a tertiary care hospital. Surg Res Pract. 2015;2015:847681. doi:10.1155/2015/847681
-
Akbulut S, Koç C, Şahin TT, et al. Akut apandisit ve perfore apandisiti öngören faktörlerin belirlenmesi [An investigation into the factors predicting acute appendicitis and perforated appendicitis]. Ulus Travma Acil Cerrahi Derg. 2021;27(4):434-442. doi:10.14744/tjtes.2020.60344
-
Westfall KM, Charles AG. Risk of perforation in the era of nonemergent management for acute appendicitis. Am Surg. 2019;85(11):1209-1212. doi:10.1177/000313481908501124
-
Omari AH, Khammash MR, Qasaimeh GR, Shammari AK, Yaseen MK, Hammori SK. Acute appendicitis in the elderly: risk factors for perforation. World J Emerg Surg. 2014;9(1):6. doi:10.1186/1749-7922-9-6
-
Tanrıkulu Y, Yılmaz G, Şen Tanrikulu C, et al. A prospective clinical study of the effects of the physical features of the appendix on perforation. Ulus Travma Acil Cerrahi Derg. 2015 Dec;21(6):440-5. doi:10.5505/tjtes.2015.77508
-
Yildirim AC, Atlanoğlu Ş, Gedik MA, et al. The predictive value of computerized tomography-assessed sarcopenia for complicated appendicitis in geriatric patients. Aging Med (Milton). 2023;6(3):222-229. doi:10.1002/agm2.12259
-
Liu P, Hao Q, Hai S, et al. Sarcopenia as a predictor of all-cause mortality among community-dwelling older people: a systematic review and meta-analysis. Maturitas. 2017;103:16-22. doi:10.1016/j.maturitas.2017.04.007
-
Cruz-Jentoft AJ, Bahat G, Bauer J, et al. Sarcopenia: revised European consensus on definition and diagnosis. Age Ageing. 2019;48(4):601. doi:10.1093/ageing/afz046
-
Pedersen BK, Febbraio MA. Muscles, exercise and obesity: skeletal muscle as a secretory organ. Nat Rev Endocrinol. 2012;8(8):457-465. doi:10.1038/nrendo.2012.49
-
Ackermans LLGC, Rabou J, Basrai M, et al. Screening, diagnosis and monitoring of sarcopenia: when to use which tool? Clin Nutr ESPEN. 2022;48:36-44. doi:10.1016/j.clnesp.2022.01.027
-
Boutin RD, Yao L, Canter RJ, Lenchik L. Sarcopenia: current concepts and imaging implications. AJR Am J Roentgenol. 2015;205(3):W255-W266. doi:10.2214/ajr.15.14635
-
Kim HY, Park JH, Lee YJ, et al. Systematic review and meta-analysis of CT features for differentiating complicated and uncomplicated appendicitis. Radiology. 2018;287(1):104-115. doi:10.1148/radiol.2017171260
-
Kim HY, Park JH, Lee SS, et al. Differentiation between complicated and uncomplicated appendicitis: diagnostic model development and validation study. Abdom Radiol (NY). 2021;46(3):948-959. doi:10.1007/s00261-020-02737-7
-
Zeng X, Shi ZW, Yu JJ, et al. Sarcopenia as a prognostic predictor of liver cirrhosis: a multicentre study in China. J Cachexia Sarcopenia Muscle. 2021;12(6):1948-1958. doi:10.1002/jcsm.12797
-
Mourtzakis M, Prado CM, Lieffers JR, et al. A practical and precise approach to quantification of body composition in cancer patients using computed tomography images acquired during routine care. Appl Physiol Nutr Metab. 2008;33(5):997-1006. doi:10.1139/h08-075
-
Ha NB, Cho SJ, Mohamad Y, et al. Visceral adipose tissue inflammation and radiographic visceral-to-subcutaneous adipose tissue ratio in patients with cirrhosis. Dig Dis Sci. 2022;67(7):3436-3444. doi:10.1007/s10620-021-07099-8
-
Itoh S, Yoshizumi T, Kimura K, et al. Effect of sarcopenic obesity on outcomes of living-donor liver transplantation for hepatocellular carcinoma. Anticancer Res. 2016;36(6):3029-3034.
-
Prado CM, Lieffers JR, McCargar LJ, et al. Prevalence and clinical implications of sarcopenic obesity in patients with solid tumours of the respiratory and gastrointestinal tracts: a population-based study. Lancet Oncol. 2008;9(7):629-635. doi:10.1016/s1470-2045(08)70153-0
-
Hamaguchi Y, Kaido T, Okumura S, et al. Impact of quality as well as quantity of skeletal muscle on outcomes after liver transplantation. Liver Transpl. 2014;20(11):1413-1419. doi:10.1002/lt.23970
-
Gursoy Coruh A, Uzun C, Akkaya Z, Halil Elhan A. The relation of CT quantified pancreatic fat index with visceral adiposity and hepatic steatosis. Turk J Surg. 2020;36(3):241-248. doi:10.47717/turkjsurg.2020.4877
-
Pokharel N, Sapkota P, Kc B, et al. Acute appendicitis in elderly patients: a challenge for surgeons. Nepal Med Coll J. 2011;13(4):285-288.
Figures
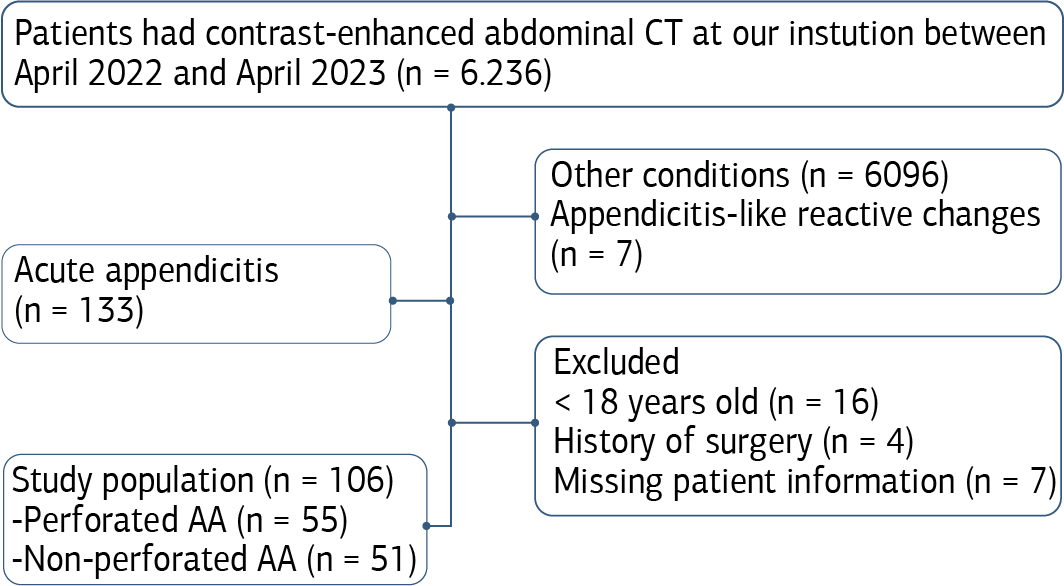
Figure 1. Flow diagram of study population selection. AA: acute appendicitis

Figure 2. Subcutaneous Adipose Tissue (SAT): Total area of tissues at -190 and -30 HU densities between the brown and yellow areas. Skeletal Muscle Area (SMA): total area of tissues at -29 and 150 HU densities between the yellow and blue areas. Visceral Adipose Tissue (VAT): total area of tissues at -150 and -50 HU densities in the blue area
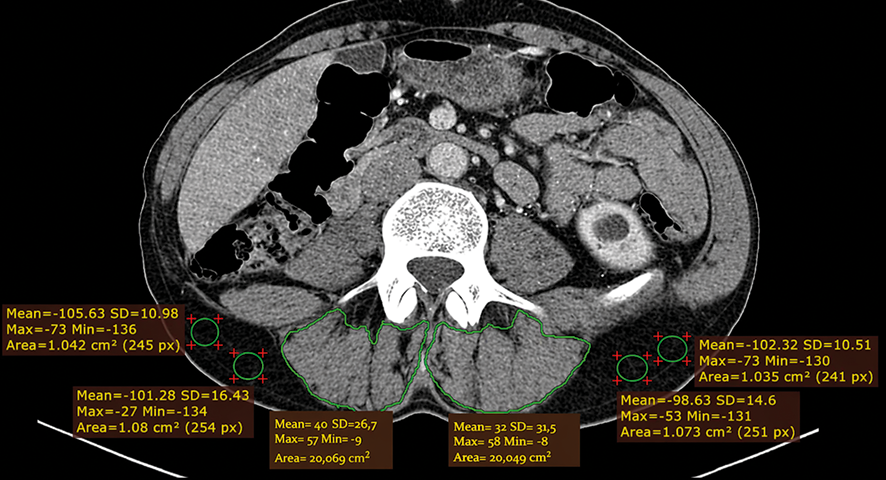
Figure 3. Intramuscular adipose Tissue Content (IMAC) values were found by dividing the HU mean of the erector spinal muscles at the L3 level by the HU average of the fat planes at the same level
Tables
Table 1. Distributions of the age of perforated and non-perforated appendicitis groups

Table 2. Pre-existing conditions of the patients
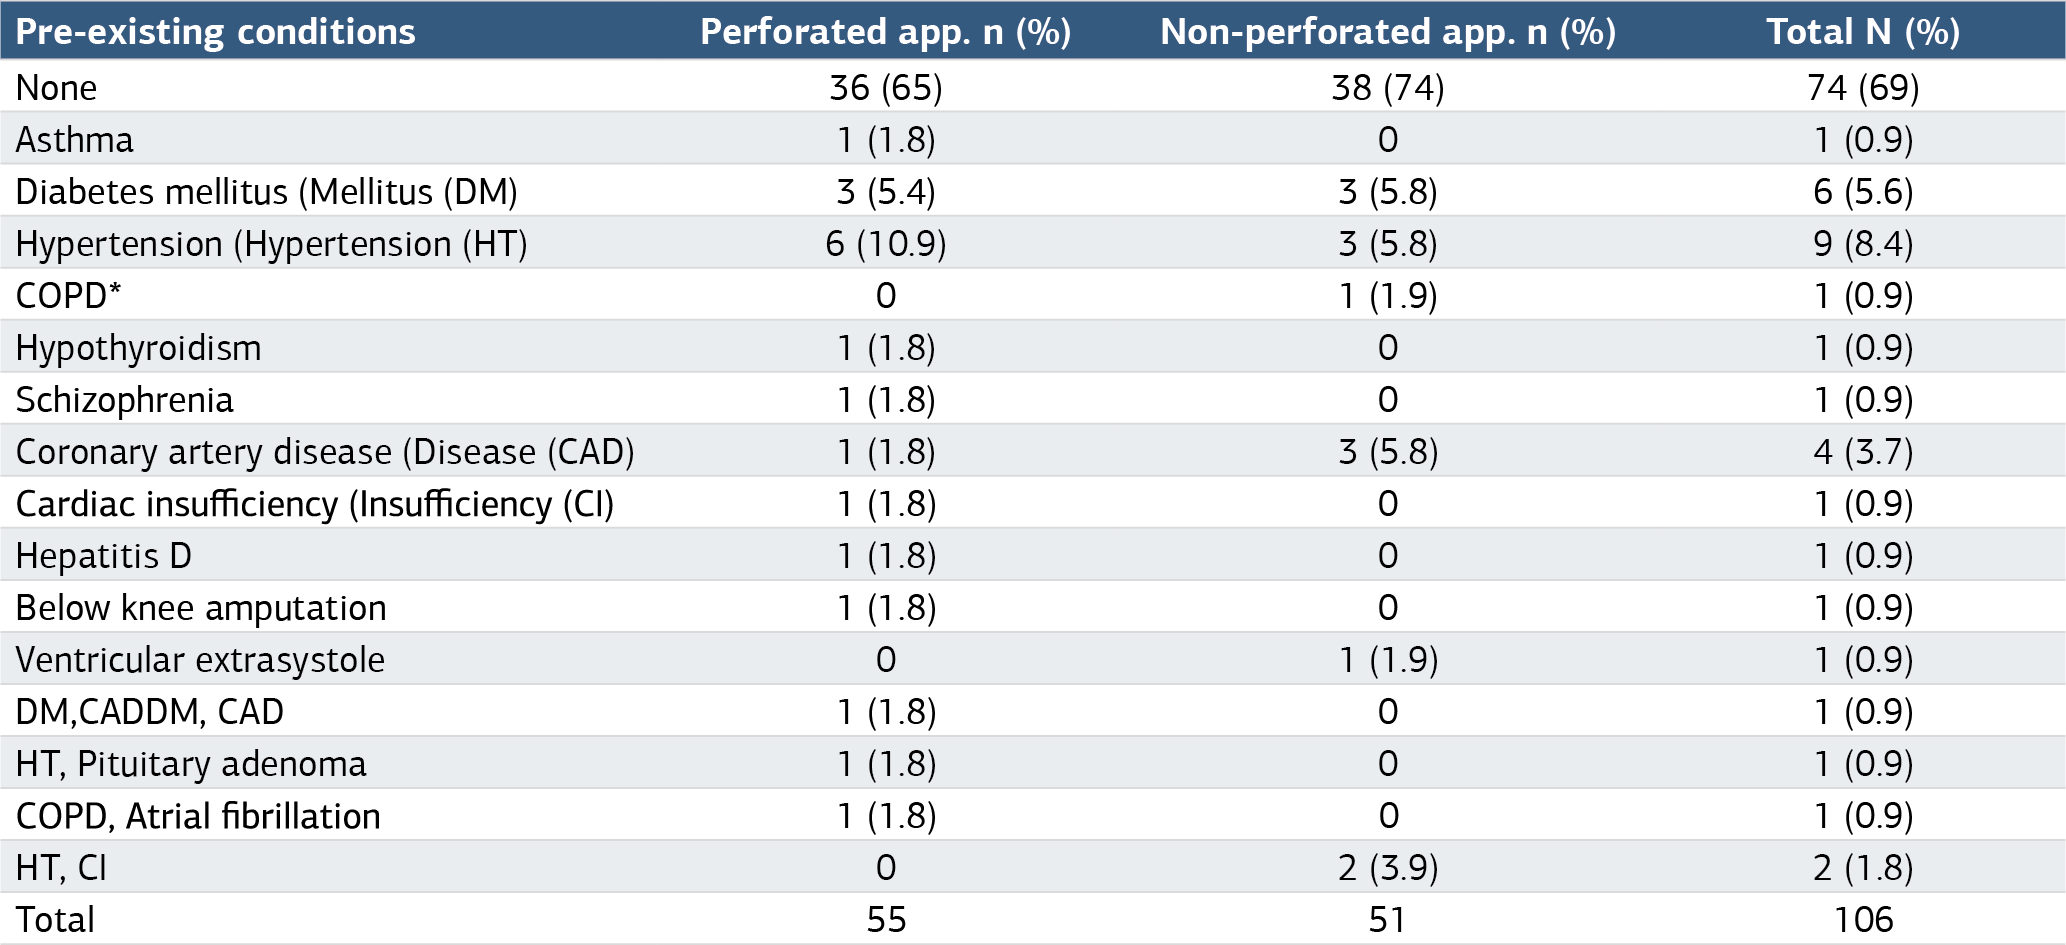
n: Number of people with this condition %: Percentage of the condition of that column *COPD: Chronic Obstructive Pulmonary Disease
Table 3. Characteristic values of the perforated and nonperforated appendicitis groups
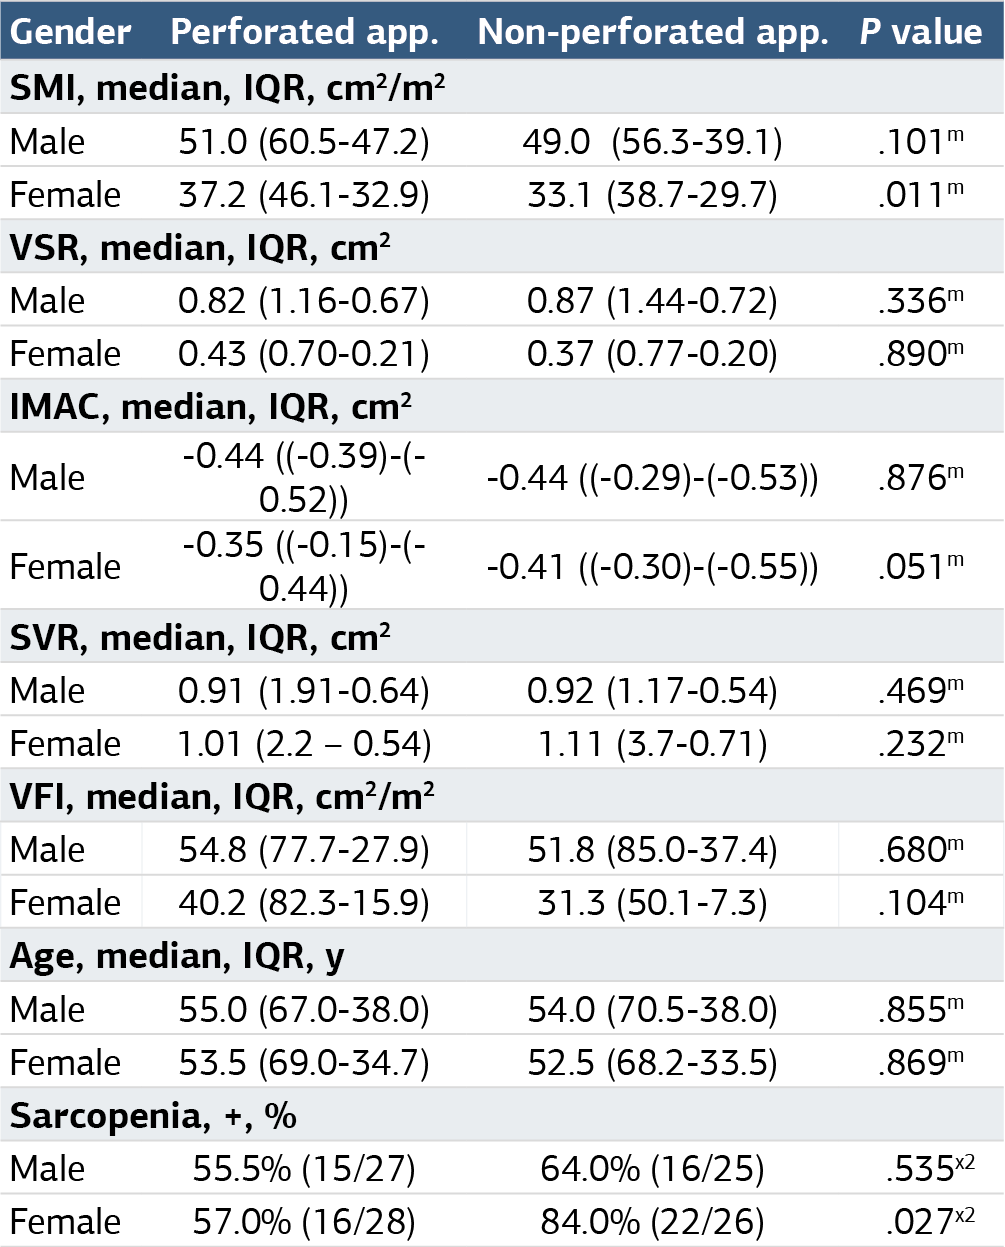
m: Mann Whitney U test result p-value, x2: Chi-Square test result p-value SMI: The Skeletal Muscle Mass Index (SMI) was determined by standardizing the skeletal muscle areas (SMA) at the L3 level based on height (cm²/m²) SMA: We identified and quantified Skeletal Muscle Areas(Areas (SMA), encompassing the psoas, erector spinal, quadratus lumborum, transversus abdominis, external and internal obliques, and rectus abdominis, using the range of -29 to 150 Hounsfield Units (HU) at the L3 vertebra level VSR: Visceral adiposity ratio (VSR), we determined by dividing the Visceral Adipose Tissue (VAT) area by the Subcutaneous Adipose Tissue (VAT) area at the L3 level IMAC: We calculated the Intramuscular Adipose Tissue Content (IMAC) by dividing the CT value of the erector spinal muscles (in HU) by the CT value of subcutaneous fat (in HU) at the L3 level SVR: Skeletal Muscle Area to Visceral Fat Area Ratio (SVR), we determined by dividing Skeletal Muscle Areas (SMA) by Visceral Adipose Tissue (VAT) at the L3 level VFI: Visceral Fat Index (VFI), was determined by standardizing the Visceral Adipose Tissue(Tissue (VAT) areas at the L3 level based on height (cm²/m²)
Additional Information
Publisher’s Note
Bayrakol MP remains neutral with regard to jurisdictional and institutional claims.
Rights and Permissions

This work is licensed under a Creative Commons Attribution-NonCommercial 4.0 International License (CC BY-NC 4.0). To view a copy of the license, visit https://creativecommons.org/licenses/by-nc/4.0/
About This Article
How to Cite This Article
Turay Cesur, Utku Eren Özkaya, Bilal Egemen Çifçi, Mustafa Dağlı. Exploring muscle and fat composition differences in acute appendicitis. Ann Clin Anal Med 2025;16(1):62-67. doi:10.4328/ACAM.22357
- Received:
- August 6, 2024
- Accepted:
- September 9, 2026
- Published Online:
- October 31, 2024
- Printed:
- January 1, 2025