
Is semaphorin 3g involved in the reno-protective effects of pioglitazone in diabetic nephropathy?
Semaphorin 3g/ pioglitazone/ diabetic nephropathy
Authors
Abstract
Aim This study investigated the role of Semaphorin 3G (Sema3G) in early diabetic nephropathy (DN) and evaluated the effects of pioglitazone on renal Sema3G expression in a diabetic rat model.
Methods DN was induced in rats using a high-fructose, high-fat diet for 3 weeks followed by intraperitoneal streptozotocin (40 mg/kg). One week after diabetes confirmation, pioglitazone (10 mg/kg/day) was administered intragastrically. Renal Sema3G gene expression was analyzed at 4, 7, and 10 weeks post-induction, alongside functional and histopathological assessments.
Results Diabetic rats exhibited significant renal dysfunction and structural damage, coinciding with progressive upregulation of Sema3G expression (peak at 7–10 weeks; P < 0.05). Pioglitazone treatment attenuated these alterations, improving renal function and morphology while significantly suppressing Sema3G overexpression.
Conclusion Sema3G upregulation may contribute to DN progression. Pioglitazone treatment appeared to confer a reno-protective effect in diabetic rats, along with a trend indicating delayed modulation of Semaphorin 3G gene expression. These findings suggest Sema3G as a potential therapeutic target in DN.
Keywords
Introduction
Diabetes mellitus (DM) is one of the most common chronic diseases worldwide. One of the primary microvascular complications, affecting about one-third of diabetic patients, is diabetic nephropathy (DN), a major contributor to end- stage renal disease 1. Hyperglycemia can lead to glomerular hypertrophy, increased mesangial matrix, renal hypoxia, and podocyte injury, all of which can progress to glomerular sclerosis and tubulointerstitial damage 2.
Semaphorins are largely classified into eight classes: only class 3 Semaphorins are secreted, whereas the rest of the classes are transmembrane proteins. Semaphorin 3G (Sema3G) is primarily expressed in vascular endothelial cells and regulates vascular functions through paracrine or autocrine signaling 3. Additionally, Sema3G has been identified as a glomerulus- specific transcript 4. Previous studies have shown that Sema3G is positively correlated with circulating leptin and adipokines and promotes insulin resistance in obese patients 5. The relationship between Sema3G and diabetes remains controversial. Sema3G knockout mice exhibited increased and prolonged albuminuria under conditions of both acute kidney inflammation and diabetes 4. In this regard, our study aimed to clarify the relationship between hyperglycemia, renal Sema3G expression, and the development of DN.
Peroxisome proliferator-activated receptors (PPARs) are nuclear transcription factors that are involved in insulin sensitivity, lipid metabolism, and inflammation. Specifically, PPAR-γ is crucial for renal physiology, as it is expressed in the renal microvasculature, as well as glomerular, mesangial, and tubular segments 6. Emerging evidence from in vitro studies has shown a direct link between Peroxisome proliferator- activated receptor-gamma (PPARγ) agonists and Sema3G expression 7. Thiazolidinediones (TZDs), which are PPARγ agonists, are widely used as insulin-sensitizing agents for the treatment of type 2 diabetes (T2D). Pioglitazone, a TZD, has demonstrated significantly better renoprotection than insulin in diabetic rats 8. In this context, we aimed to determine whether the reno-protective effect of pioglitazone in diabetes could be linked to Sema3G modulation. Thus, we explored Sema3G gene expression levels in the kidneys of diabetic rats, with and without pioglitazone treatment, and assessed their relationship with functional and histological renal changes.
Materials and Methods
Experimental AnimalsNinety male Albino Wistar rats (12-14 weeks and 150-200 g) were procured from the Physiology Department Animal Breeding Facility, Faculty of Medicine, Alexandria University. Animals were kept under a controlled light-dark cycle (12-h light and 12-h dark cycle; 7 p.m.–7 a.m.), with free access to standard lab chow and sterilized water.
Study DesignAfter a one-week acclimatization period, 90 rats were randomly allocated into three groups based on the study duration: 4 weeks, 7 weeks, and 10 weeks. Each group was further divided into three subgroups: control (n=8), diabetic nephropathy (DN; n=11), or diabetic nephropathy with pioglitazone treatment (DN+Pio; n=11). Control rats (n=24) received standard chow and normal drinking water. Pioglitazone (Osaka-Japan) was administered orally at 10 mg/kg/day, suspended in 1ml of 0.5 % carboxy methyl cellulose (CMC) (Lanxess, Turkey), starting one week after confirmation of the disease model and continuing until the end of the experiment. Control and DN groups were given an equivalent volume of the drug vehicle (0.5% CMC) for the same duration.
Induction of DiabetesDiabetes was induced in 66 rats by feeding them a high- fructose, high-fat diet (HFHF) for three weeks to promote insulin resistance. The diet consisted of 58% calories from fat, 27.5% from carbohydrates, and 14.5% from proteins, with a total caloric value of ~4,900 kcal/kg 9. Rats were also given a 10% fructose solution as drinking water. After three weeks, the rats were fasted overnight and injected intraperitoneally (I.P) with freshly constituted streptozotocin (STZ) (Sigma Aldrich, USA) (40 mg/kg dissolved in 0.1 M cold sodium citrate buffer, pH 4.5) to induce diabetes 10. Blood samples were taken from the tail vein 72 hours after STZ administration, and non-fasting blood glucose (NFBG) levels were measured using a portable glucometer (OneTouch Select, USA). Rats with NFBG levels ≥ 300 mg/dL were considered diabetic 11.
Animals SacrificeBefore the experiment was terminated, 24-hour urine samples were collected to measure urine volume and albumin excretion. Each rat was placed individually in metabolic cages with free access to standard chow and water. Rats were sacrificed using I.P. anesthesia after the end of 4-weeks, 7-weeks, and 10-weeks. Blood was collected by cardiac puncture. Then, the kidneys were removed and weighed. One kidney from each rat was frozen in liquid nitrogen and stored at -80°C for RNA extraction, while the other was fixed in formalin for histological analysis.
Biochemical Analysis
Serum ParametersFasting serum glucose, total cholesterol, and triglycerides were measured in terminal blood samples using colorimetric enzymatic methods with reagent kits from BioSystems S.A. (Barcelona, Spain). The analytical performance of these methods was within the manufacturer’s specifications.
Serum urea was determined using the Berthelot enzymatic method, and blood urea nitrogen (BUN) was calculated as BUN (mg/dL) = urea (mg/dL) / 2.1428. Serum creatinine (SCr) was measured by the Jaffe kinetic method Reagent kits from Diamond Diagnostics (Hannover, Germany) were used following the manufacturer’s guidelines. The estimated glomerular filtration rate (eGFR) was calculated using the following formula 12:
eGFR = 5862 x W0.695 x C-1.150 x U-0.391, where eGFR is measured in (µL/min), W is rat weight (g), C is creatinine concentration (µmol/L), and U is urea concentration (mmol/L)
Urinary Albumin EstimationUrinary albumin levels were measured using a rat-specific enzyme-linked immunosorbent assay (ELISA) kit (Fine Test, Wuhan, China), following the manufacturer’s instructions 13. The urinary albumin excretion rate (UAER) was calculated using the following formula: UAER (µg/min) = albumin concentration in urine (µg/mL) × 24-hour urine volume (mL)
Quantitative reverse transcription PCR (qRT PCR) for Sema3G
Renal total RNA was extracted following the manufacturer’s protocol of RNeasy Mini Kit (Qiagen, Germany). Complementary DNA (cDNA) was synthesized using the High-Capacity cDNA Reverse Transcription Kit (Thermo Fisher Scientific, USA). Real- time PCR was then performed with Maxima SYBR Green qPCR Master Mix (Thermo Fisher Scientific, USA) and specific primers for Sema3G and the reference gene β-actin (Thermo Fisher Scientific, USA). Primers were designed using Primer Express 3.0 (Applied Biosystems, Carlsbad, CA, USA) and validated for specificity using the NCBI Primer-BLAST tool. Relative expression of the Sema3G gene was calculated using the 2−ÞÞCT method 5.
The primer sequences used for Sema3G gene amplification were as follows: forward 5’-GGCCTCACTGCTGATTTCCT, reverse 5’-CCATCACAAACCGGGGATCA. The primer sequences used for the amplification of the β-actin reference gene were as follows: forward 5’-ACCCGCGAGTACAACCTTC, reverse 5’-ATCGTCATCCATGGCGAACTG.
Histological SectionsOne kidney from each rat was collected for histopathological analysis, fixed in 10% neutral formaldehyde, and embedded in paraffin. Serial cross-sections (4–6 µm) were prepared and stained with hematoxylin and eosin (H&E) using standard protocols to assess glomerular and tubular structural changes. Samples were examined under a light microscope, and representative images were captured at each time point using a camera attached to an Olympus BX41 microscope at ×200 magnification.
Statistical AnalysisData are expressed as mean ± SD for normally distributed variables and as median with interquartile range for non- normally distributed data. Results at 4, 7, and 10 weeks were analyzed separately using one-way ANOVA or the Kruskal- Wallis test, followed by post-hoc pairwise comparisons without adjustment for multiple comparisons. All statistical tests were two-tailed, and p < 0.05 was considered significant. Analyses were performed using PASW Statistics 20.0 (SPSS Inc., Chicago, IL, USA). Associations between variables were assessed using Spearman correlation.
Ethical ApprovalThis study was approved by the Ethics Committee of Alexandria Faculty of Medicine (Date: 2020-12-17, No: 0201425).
Results
Terminal Body Weight and Kidney Weights of Diabetic Rats
DN rats showed significantly lower terminal body weights compared to controls at 4 weeks (P=0.003), 7 weeks (P<0.0001), and 10 weeks (P<0.0001). However, body weights were significantly higher in pioglitazone-treated rats compared to DN groups at all time points (P=0.012 at 4 weeks, P=0.046 at 7 weeks, and P<0.0001 at 10 weeks) (Figure 1A-C). The kidney weight-to-body weight ratios (left and right) were elevated in diabetic rats across all time points relative to controls, but pioglitazone partially reduced this ratio in the right kidney at 10 weeks (Figure 1A-C).
Effect of pioglitazone on Fasting Blood Glucose and Lipid ProfileDiabetic rats exhibited altered glucose and lipid metabolism starting from 4 weeks post-STZ injection and continuing through week 10. Fasting serum triglycerides and total cholesterol levels were significantly higher in the diabetic groups compared to controls at all time points. Pioglitazone treatment reduced serum triglycerides at 7 and 10 weeks, while a modest reduction in total cholesterol was observed only at 7 weeks (P ≤ 0.05 vs. diabetic rats; Figure (1D-E). Fasting blood glucose (FBG) was significantly higher in diabetic rats compared to controls at 4 weeks (137%, P = 0.001), 7 weeks (496%, P = 0.0001), and 10 weeks (388%, P = 0.0006). This hyperglycemia was normalized in pioglitazone-treated groups (Figure 1F).
Effects of pioglitazone on Renal Function in DN RatsCompared to controls, DN rats showed significant deterioration of renal function. This decline became evident 4 weeks after STZ injection and persisted through the 10-week timepoint. Pioglitazone treatment significantly improved renal function in diabetic rats (Table 1).
Effect of Pioglitazone on Sema3G Gene Expression in Renal Tissue of Diabetic RatsSema3G relative gene expression was significantly elevated in the renal tissue of diabetic rats at 7 and 10 weeks (232%, P = 0.045) (169%, P = 0.003), respectively, compared to controls. Pioglitazone treatment did not significantly affect Sema3G expression across the three-time points, although a non- significant trend of reduction was observed at 10 weeks. (-38%, P = 0.07) (Figure 2A).
Histopathological AssessmentH&E staining revealed normal renal structure in the control group, with intact glomerular sacs and well-organized renal tubules (Figure 3A, D, G). In contrast, the DN group showed signs of glomerular atrophy, including expanded glomerular cavities and shrunken glomeruli. Renal tubules were dilated and disorganized and showed vacuolated epithelial cells (Figure 3B, E, H). Pioglitazone treatment significantly reduced these degenerative changes across all time points, helping restore renal tissue structure. The treatment mitigated glomerular atrophy, vacuolation of tubular epithelial cells, and tubular architecture (Figure 3C, F, I).
Discussion
Preventing DN remains a significant challenge in clinical medicine. In our study, we observed an upregulation of the Sema3G gene in the renal tissue of diabetic rats, with a tendency toward reduced expression following prolonged treatment with pioglitazone.
The successful establishment of the DN model in this study was confirmed by elevated albuminuria, decreased eGFR, and increased serum creatinine and BUN levels. Histopathological analysis revealed glomeruli-tubular ischemic and degenerative changes starting at week 4 and worsening by weeks 7 and 10. These findings are consistent with previous studies reporting histopathological changes, such as glomerular basement membrane thickening and mesangial cell proliferation, in diabetic rats four weeks post-STZ injection 14. The primary mechanisms underlying DN include abnormal metabolic reprogramming, characterized by glucotoxicity, lipotoxicity, inflammation, and fibrosis 15. Hyperglycemia stimulates inflammatory mediator expression in kidney cells, which promotes macrophage recruitment, activation, and increased prevalence of M1 pro-inflammatory macrophages over the anti-inflammatory M2 16,17.
Sema3G Upregulation with Hyperglycemia and Its Potential Role in DN ProgressionIn the present study, Sema3G gene expression was upregulated in the renal tissue of diabetic rats from week 7 post-STZ, with a positive correlation to hyperglycemia. Relevant to this finding, a recent in-vitro study has shown that hyperglycemia stimulates Sema3G expression in proximal tubule cells 18. Luo et al. 19 also reported increased Sema3G expression in cultured human endothelial cells exposed to high glucose, along with elevated serum Sema3G levels in both T2DM patients and HFD-fed mice. Recent findings suggest a connection between Sema3G and M1 proinflammatory macrophages. Shoda et al. 20 linked Sema3G to the pathogenesis of rheumatoid arthritis, a condition characterized by chronic inflammation. Their research demonstrated that Sema3G is expressed in inflamed joints in both humans and mice, where it facilitates macrophage migration and proliferation. This consensual relationship between Sema3G and M1 macrophages may also be relevant in DN, providing a possible explanation for how Sema3G contributes to its pathogenesis.
In our study, Sema3G renal expression was inversely related to eGFR, indicating that higher Sema3G levels were associated with reduced renal function. Additionally, Sema3G was positively correlated with elevated BUN and albuminuria, further supporting its role in DN progression. These findings align with previous studies that have associated Sema3G with both diabetes and its complications 21. However, there is conflicting evidence regarding Sema3G’s role in kidney disease. For instance, in vitro experiments showed that podocytes lacking the Sema3G gene produced higher levels of inflammatory mediators when stimulated with lipopolysaccharide (LPS) 4. This discrepancy might be due to differences between in vitro and in vivo models. Additionally, LPS-induced cell injury may not mimic the physiological inflammatory pathways 22.
Pioglitazone Improves Hyperglycemia and Renal Function in DN: Modulation of Sema3G Gene ExpressionPioglitazone directly activates endogenous renal PPARγ, which suppresses inflammatory molecules and reduces collagen synthesis in cultured mesangial cells 23. In this study, pioglitazone treatment in diabetic rats effectively reduced FBG levels, increased final body weight, and lowered the kidney- to-body weight ratio. Additionally, pioglitazone significantly decreased SCr, BUN, and albuminuria levels while elevating eGFR, indicating improved renal function. Moreover, Pioglitazone significantly decreased histological degenerative changes at all time points, aiding in the restoration of renal tissue structure by mitigating glomerular atrophy, mesangial matrix expansion, tubular dilation, and epithelial cell vacuolation. These findings align with previous studies showing that PPAR-γ activation helps mitigate hyperglycemia, oxidative stress, inflammation, fibrosis, and kidney injury in DN 6,24. Emerging evidence suggests that Sema3G is a downstream effector of PPAR-γ 7. However, it remains unclear whether the modulation of Sema3G contributes to the reno-protective effects of PPAR-γ agonists in DN, highlighting the need for further investigation. Our study found that pioglitazone showed a non-significant trend of reducing Sema3G gene expression in diabetic rats at the 10-week time point. Previous in vitro studies have reported pioglitazone- induced stimulation of Sema3G in human endothelial cells 7, but in vivo, other factors, including hyperglycemia, may influence this relationship. To our knowledge, this is the first in vivo study exploring the effect of pioglitazone on Sema3G expression in the renal tissue of diabetic rats. By reducing blood glucose levels, pioglitazone may indirectly contribute to lower Sema3G expression, suggesting a complex interplay between hyperglycemia, Sema3G, and PPAR-γ.
Limitations
This study presents a few limitations. Although we observed increased Sema3G gene expression in the renal tissue of diabetic rats, we could not evaluate corresponding protein expression changes. Furthermore, the molecular mechanism driving the hyperglycemia-induced rise in renal Sema3G expression in vivo is still unknown. Future research with longer time points is necessary to examine the impact of pioglitazone administration on the renal expression of the Sema3G gene.
Conclusion
To summarize, this study reported that renal Sema3G gene expression is upregulated in DN. Sema3G levels positively correlate with hyperglycemia, SCr, BUN, and albuminuria while negatively correlating with eGFR, suggesting its potential role in DN progression. Pioglitazone administration after diabetes induction partially alleviated the metabolic and renal functional decline as well as reduced glomerular atrophy and tubular vacuolation. We propose that modulation of Sema3G may contribute to the reno-protective effects of pioglitazone in DN, as treatment resulted in a downregulation of renal Sema3G expression in diabetic rats at the 10-week time point, but with a non-significant trend.
Declarations
Ethics Declarations
This study was approved by the Ethics Committee of Alexandria Faculty of Medicine (Date: 2020-12-17, No: 0201425)
Animal and Human Rights Statement
All procedures performed in this study were in accordance with the ethical standards of the institutional and/or national research committee and with the 1964 Helsinki Declaration and its later amendments or comparable ethical standards.
Data Availability
The datasets used and/or analyzed during the current study are not publicly available due to patient privacy reasons but are available from the corresponding author on reasonable request.
Conflict of Interest
The authors declare that there is no conflict of interest.
Funding
None
Scientific Responsibility Statement
The authors declare that they are responsible for the article’s scientific content, including study design, data collection, analysis and interpretation, writing, and some of the main line, or all of the preparation and scientific review of the contents, and approval of the final version of the article.
References
-
Saran R, Robinson B, Abbott KC, et al. US renal data system 2016 annual data report: epidemiology of kidney disease in the United States. Am J Kidney Dis. 2017;69(3):A7-8.
-
DeFronzo RA, Reeves WB, Awad AS. Pathophysiology of diabetic kidney disease: impact of SGLT2 inhibitors. Nat Rev Nephrol. 2021;17(5):319-34.
-
Kutschera S, Weber H, Weick A, et al. Differential endothelial transcriptomics identifies semaphorin 3G as a vascular class 3 semaphorin. Arterioscler Thromb Vasc Biol. 2011;31(1):151-9.
-
Ishibashi R, Takemoto M, Akimoto Y, et al. A novel podocyte gene, semaphorin 3G, protects glomerular podocyte from lipopolysaccharide-induced inflammation. Sci Rep. 2016;6(1):25955.
-
Liu M, Xie S, Liu W, et al. Mechanism of SEMA3G knockdown-mediated attenuation of high-fat diet-induced obesity. J Endocrinol. 2020;244(1):223-36.
-
Ma Y, Shi M, Wang Y, Liu J. PPARγ and its agonists in chronic kidney disease. Int J Nephrol. 2020;2020:2917474.
-
Liu W, Li J, Liu M, Zhang H, Wang N. PPAR‐γ promotes endothelial cell migration by inducing the expression of Sema3g. J Cell Biochem. 2015;116(4):514-23.
-
Ohtomo S, Izuhara Y, Takizawa S, Yamada N, Kakuta T, De Strihou CVY, et al. Thiazolidinediones provide better renoprotection than insulin in an obese, hypertensive type II diabetic rat model. Kidney Int. 2007;72(12):1512-9.
-
Gheibi S, Kashfi K, Ghasemi A. A practical guide for induction of type-2 diabetes in rat: Incorporating a high-fat diet and streptozotocin. J Pharmacol Pharmacother. 2017;95:605-13.
-
Wilson RD, Islam M. Fructose-fed streptozotocin-injected rat: an alternative model for type 2 diabetes. Pharmacol Rep. 2012;64(1):129-39.
-
Srinivasan K, Viswanad B, Asrat L, Kaul CL, Ramarao P. Combination of high- fat diet-fed and low-dose streptozotocin-treated rat: A model for type 2 diabetes and pharmacological screening. Pharmacol Res. 2005;52(4):313-20.
-
Besseling PJ, Pieters TT, Nguyen ITN, et al. A plasma creatinine- and urea- based equation to estimate glomerular filtration rate in rats. Am J Physiol Renal Physiol. 2021;320(3):518-24.
-
Oraby MA, El-Yamany MF, Safar MM, Assaf N, Ghoneim HA. Amelioration of early markers of diabetic nephropathy by linagliptin in fructose-streptozotocin- induced type 2 diabetic rats. Nephron. 2019;141(4):273-86.
-
Wang J, Hu L, Chen Y, et al. Sitagliptin improves renal function in diabetic nephropathy in male Sprague Dawley rats through upregulating heme oxygenase-1 expression. Endocrine. 2019;63(1):70-8.
-
Tervaert TWC, Mooyaart AL, Amann K, et al. Pathologic classification of diabetic nephropathy. J Am Soc Nephrol. 2010;21(4):556-63.
-
Zhou W, Liu Y, Hu Q, Zhou J, Lin H. The landscape of immune cell infiltration in the glomerulus of diabetic nephropathy: evidence based on bioinformatics. BMC Nephrol. 2022;23(1):303.
-
Tang SCW, Yiu WH. Innate immunity in diabetic kidney disease. Nat Rev Nephrol. 2020;16(4):206-22.
-
Caceres PS. High Glucose Stimulates Basolateral Secretion of Semaphorin 3G by Proximal Tubule Cells: Role in Anti-Angiogenesis: SA-PO243. J Am Soc Nephrol. 2022;33(11S):668.
-
Luo XY, Fu X, Liu F, Luo JY, Chen AF. Sema3G activates YAP and promotes VSMCs proliferation and migration via Nrp2/PlexinA1. Cell Signal. 2023;105:110613.
-
Shoda J, Tanaka S, Etori K, et al. Semaphorin 3G exacerbates joint inflammation through the accumulation and proliferation of macrophages in the synovium. Arthritis Res Ther. 2022;24(1):134.
-
Chen DY, Sun NH, Chen X, et al. Endothelium-derived semaphorin 3G attenuates ischemic retinopathy by coordinating β-catenin–dependent vascular remodeling. J Clin Invest. 2021;131(4):e135296.
-
Rathinam VAK, Zhao Y, Shao F. Innate immunity to intracellular LPS. Nat Immunol. 2019;20(5):527-33.
-
Ko GJ, Kang YS, Han SY, et al. Pioglitazone attenuates diabetic nephropathy through an anti-inflammatory mechanism in type 2 diabetic rats. Nephrol Dial Transplant. 2008;23(9):2750-60.
-
Makino H, Miyamoto Y, Sawai K, et al. Altered gene expression related to glomerulogenesis and podocyte structure in early diabetic nephropathy of db/db mice and its restoration by pioglitazone. Diabetes. 2006;55(10):2747-56.
Figures
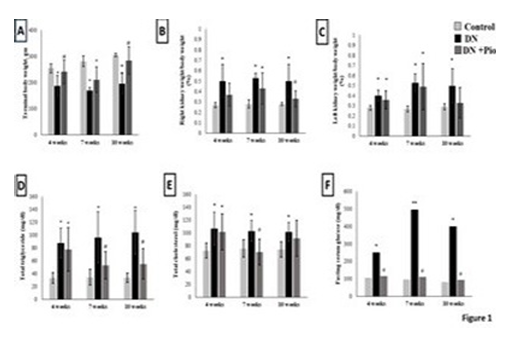
Figure 1. Body weights, lipid profile, and fasting serum glucose. Terminal body weight (A), right kidney weight/ total body weight % (B), left kidney weight/ total body weight % (C) fasting serum total triglycerides (D), fasting serum total cholesterol (E), and fasting serum blood glucose (F) in control rats and in diabetic rats with (DN+ Pio) or without (DN) pioglitazone treatment at 4,7and 10 weeks post-STZ injection. Data are means ± SD except in the case of fasting serum blood glucose are medians from n = 8-10 per group. P values are from one-way ANOVA, except in the case of fasting serum blood glucose, Kruskal Wallis test. *, ** P <0.05 and P <0.001 respectively relative to control. #, ##, significant difference between DN and DN+Pio rats at P <0.05 and P <0.001 respectively
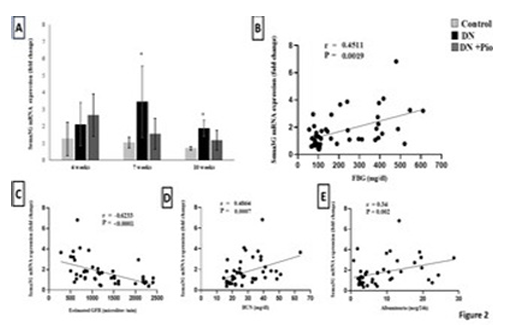
Figure 2. Sema3G mRNA expression in the kidney and its correlation with fasting blood glucose and renal functions. (A) Sema3G mRNA expression in renal homogenate at each time- point. Quantitative analysis of Sema3G mRNA expression in the kidneys in control rats and in diabetic rats with (DN+Pio) or without (DN) pioglitazone treatment. Data are meant ±SD. (n=5 rats/ group). *, ** P <0.05, P <0.001 versus control. #, ## P <0.05 and P <0.001 respectively versus DN rats. Correlation analysis of Sema3G mRNA expression in renal homogenate across all experimental groups with (B) fasting blood glucose (r = 0.45, P = 0.0019), (C) eGFR (r = -0.62, P < 0.001), (D) BUN (r = 0.48, P = 0.0007) and (E) albuminuria (r = 0.34, P = 0.002). r is the Spearman correlation coefficient (n=45 rats)
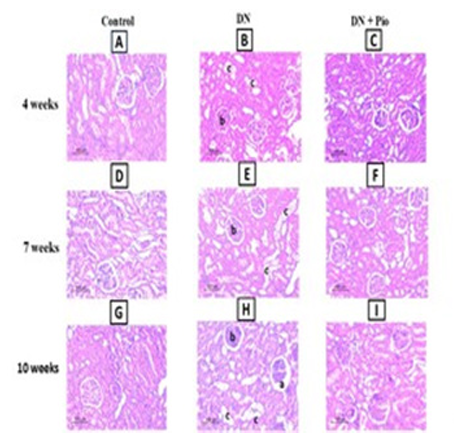
Figure 3. Effect of pioglitazone on renal morphological changes of the studied groups. Representative H&E photomicrography of kidney sections. Architectural changes demonstrated as (a=glomerular atrophy, b= mesangial matrix expansion & c= tubular vacuolation of cytoplasm) from the kidney at 4 (A-B-C), 7 (D-E-F) and 10 weeks (G-H-I) in diabetic rats with (DN + Pio) or without (DN) pioglitazone treatment vs control rats. (original magnification x 200, n=4/group)
Tables
Table 1. Effects of pioglitazone on renal function in DN rats
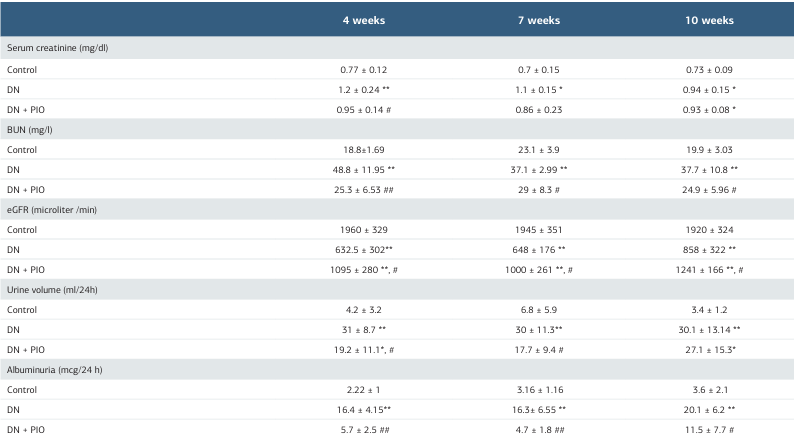
Data are expressed as Mean ± SD. n = 6-10 per group. DN = Diabetic nephropathy group, DN + PIO= Pioglitazone treated group, BUN=Blood urea nitrogen, eGFR= estimated glomerular filtration rate. P values are from one-way ANOVA. (*, **) indicates a significant difference versus the control group P <0.05 and P <0.001, respectively. (#, ##) indicates a significant difference versus DN group P <0.05 and P <0.001, respectively.
Additional Information
Publisher’s Note
Bayrakol MP remains neutral with regard to jurisdictional and institutional claims.
Rights and Permissions

This work is licensed under a Creative Commons Attribution-NonCommercial 4.0 International License (CC BY-NC 4.0). To view a copy of the license, visit https://creativecommons.org/licenses/by-nc/4.0/
About This Article
How to Cite This Article
Yousra Zaki, Samiha ElSayed, Eman Mohamed Fawzy, Yasmine Nabil Kamel, Heba Gouda, Maram Allam, Marianne Basta. Is semaphorin 3g involved in the reno-protective effects of pioglitazone in diabetic nephropathy? Ann Clin Anal Med 2025;16(12):845-850
- Received:
- November 10, 2024
- Accepted:
- December 16, 2024
- Published Online:
- February 6, 2025
- Printed:
- December 1, 2025