
Abstract
AimThe aim of the study was to investigate the effects of tube current and tube voltage selection on patient dose in adult and pediatric abdominal CT protocols by analyzing them both statistically and with PCA and cluster methods.MethodsA total of 24 CT phantom scans (12 pediatric and 12 adult) were performed and CTDIvol and DLP values in the dose sheet were recorded. In the scans, 50 mAs, 60 mAs, 80 mAs, and 100 mAs tube currents were used, respectively. For each mAs value, tube voltages of 80 kVp, 110 kVp, and 130 kVp were selected.ResultsThe loading plot obtained the relationships between the variables in the Principal Component 1 (PC1) and Principal Component 2 (PC2) space. PC1 was obtained as 84.67% and PC2 as 14.64%, and the sum of both PCs was observed to constitute 99.31% of the total variance. It was observed that the values obtained with 100 mAs and 130 kVp in CT scans had the highest heavy loadings for PC1. In cluster analysis, it was observed that all the data obtained from CT scans performed with 80 kVp at different mAs values with both adult and pediatric abdomen phantoms were in the same Group.ConclusionPCA and cluster analysis are advantageous in terms of ease of use and qualitative assessment. PCA method can be used to evaluate the compliance of radiation with standards in scans performed with different CT devices used and to examine multiple parameters simultaneously.
Keywords
Introduction
Computed Tomography (CT) is a modern device used in diagnostic radiology for diagnostic/therapeutic purposes in different age groups. X-ray or ionizing radiation is used in CT scans. Ionizing radiation has the energy to change the structure of cells and molecules in the human body.1
Based on epidemiological studies, it is known that radiation can cause cancer. Therefore, the increasing use of CT has become an important issue as it will cause harmful effects such as hereditary and genetic diseases.2 In CT scans, patient exposure to radiation varies depending on the scanning protocols of different institutions.3 Differences in the make and model of CT scanners, differences in patients (e.g., clinical indication for scanning, patient size, gender, and age), protocol selection of the healthcare personnel obtaining the imaging, and the relevant CT scan parameters cause changes in radiation dose.3 Performing CT scans by reducing radiation dose while preserving the quality of diagnostic images protects patients from overexposure. Unnecessary radiation exposure is a bigger problem, especially in pediatric patients. The reason is that children’s tissues are more radiosensitive than adults and have a longer lifespan for radiation-induced damage to occur.4 Therefore, adjusting the scanning parameters according to the body structure of children is an important factor in terms of their exposure to less radiation.5
Diagnostic reference levels (DRLs) are used in diagnostic radiology to avoid unnecessary radiation.6 The use of DRLs has reduced dose variation among imaging centers and hospitals to some extent.7 In addition to DRL, methods such as automatic tube current modulation (ATCM) and iterative reconstruction (IR) are also recommended to reduce patient exposure.8 However, when it is desired to reduce the radiation dose, image quality should also be taken into consideration. For this purpose, measurements are made using phantoms and the volume CT dose index (CTDIvol) or dose length product (DLP) obtained on the dose page is used as patient exposure indicators.6 CTDI is the basic dose descriptor in CT and is recorded for a single rotation of the X-ray source. The unit of CTDI is milligray (mGy).9 DLP is a parameter obtained by multiplying CTDIvol by the total length and is used to calculate the radiation dose received by the patient. Its unit is expressed as mGy*cm. In order to make generalizations in the evaluation of dose optimization in CT, a lot of data need to be evaluated. Therefore, machine learning techniques are used to detect outliers from a large data set.10
Principal Component Analysis (PCA), one of the unsupervised Machine Learning techniques, is a statistical method used to analyze similarities and differences in data qualitatively and quantitatively. It is widely used in different disciplines to reduce the size of multidimensional and interrelated data.11 Therefore, PCA is a widely adaptable method for analyzing different data sets obtained in different disciplines.12 In the PCA method, the importance of the data to be analyzed, their weighted averages, and their effects on the outputs can be examined.13
The aim of the study was to investigate the effects of tube current and tube voltage selection on patient dose in adult and pediatric abdominal CT protocols by analyzing them both statistically and with PCA and cluster methods.
Materials and Methods
CT Machine and Imaging Protocol (CT Scanning and Phantom)In the study, CT scans were performed using the Somatom Go. Up 16 Slice (Siemens AG, Forchheim, Germany) and abdomen phantom were used (Wire in Air Phantom, Siemens Healthineers, Germany) for CT (Figure 1).
A total of 24 CT phantom scans (12 pediatric and 12 adult) were performed. In the scans, 50 mAs, 60 mAs, 80 mAs, and 100 mAs tube currents were used, respectively. For each mAs value, tube voltages of 80 kVp, 110 kVp, and 130 kVp were selected separately. CTDIvol and DLP values on the dose page were recorded in different abdomen phantom CT scans. Tube voltage selection greater than 130 kVp could not be made in the CT device used in the study.Ethical ApprovalNo animal or human studies were carried out by the author for this article.Statistical AnalysisDescriptive statistics for the features emphasized were expressed as Mean and Standard Deviation (SD). The Kruskal-Wallis test was used to compare the groups in terms of these features. The Spearman Correlation Coefficient was calculated to determine the relationship between the variables. SPSS (IBM SPSS Statistics 24) statistical package program was used for calculations and the statistical significance level was taken as 5%.Principal Component Analysis and Cluster AnalysisIn PCA and cluster analysis, only kVp values were written in parentheses for both adult and pediatric patients to make the data understandable. Patients indicated with 1, 2, 3, and 4 expressed 50, 60, 80, and 100 mAs values, respectively. In the study, OriginPro 2022 (OriginLab Corporation, Northampton, MA) was used for PCA, cluster analysis, and all data processing.Reporting GuidelinesThe study was reported in accordance with STROBE guideline.
Results
In the study, CT scans were performed at different mAs and kVp values using an abdomen phantom in pediatric and adult patient protocols, and CTDIvol and DLP values were measured on the dose page. While the CTDIvol values obtained at 50 mAs in the pediatric and adult protocols changed, it was detected that these values were the same at 60, 80, and 100 mAs. It was observed that the DLP values changed with the increase of both kVp and mAs values. It was determined that the CTDIvol and DLP values measured in the pediatric patients were higher at the same kVp values.Statistical analysisIn the study, firstly, mean ± SD was calculated for the features focused on. Kruskal-Wallis test was used to compare the groups in terms of these features and the results obtained are shown in Table 1. A comparison of CTDIvol and DLP values was made according to both mAs values (50 mAs, 60 mAs, 80 mAs, and 100 mAs) and patient type (Adult, Pediatric) (Table 1).
According to mAs values and patients, the total mean ± SD value for CTDIvol was 4.3658 ± 3.22172 and the total mean ± SD value for DLP was 175.421 ± 127.5346. The averages of CTDIvol and DLP values measured at different mAs values were found to be statistically significant (p<0.05). In the analysis performed according to patient groups, p=0.936 for CTDIvol value and p=0.769 for DLP value were found.
A comparison of CTDIvol and DLP values obtained at different mAs values (groups) in Adult and Pediatric phantom CT examinations is shown in Table 2. In the comparison of CTDIvol and DLP values detected at different mAs values in pediatric phantom CT examinations, p values were found to be 0.190 and 0.151, respectively. In the comparison of CTDIvol and DLP values found at different mAs values in adult phantom CT examinations, p values were found to be 0.148 and 0.243, respectively (Table 2).PCA and Cluster analysisIn the study, a total of 24 (12 adult, 12 pediatric) examinations were performed in the CT device at different kVp and mAs values, and the determined CTDIvol and DLP values were shown qualitatively by the PCA method and cluster analysis (Figure 2). The relationships between variables in the Principal Component 1 (PC1) and Principal Component 2 (PC2) space were reached with the loading plot. PC1 was obtained as 84.67%, PC2 as 14.64%, and the sum of both PCs was observed to constitute 99.31% of the total variance. In the loading graph, CTDIvol, DLP, and kVp were seen to have similar heavy loadings for PC2. P4 (130 kVp) and A4 (130 kVp) values obtained with 100 mAs and 130 kVp in pediatric and adult phantom CT scans, were observed to have the highest heavy loadings for PC1 (Figure 2). In the cluster analysis, the distribution of the data uploaded to the system in 2 different groups is shown in Figure 3. As a result of the analysis, the PC1 and PC2 scores detected and the groups in which the patients were included are shown in Table 3. It was observed that all the data obtained from the CT scans performed with 80 kVp at different mAs values with both Adult and Pediatric abdomen phantoms were in Group 1.
Discussion
Tube voltage (kVp) is a scanning parameter that has an exponential relationship with radiation exposure. While kVp is a parameter that determines image quality, lowering kVp increases image noise.14
Since contrast and image noise parameters are related to tube current and tube voltage, it is necessary to obtain the lowest radiation dose without compromising the accuracy of diagnosis in CT scans. In addition, tube current and tube voltage should be adjusted according to the size of the patient.15
CTDIvol and DLP values, which can vary depending on the mAs and kVp values used during a CT scan, are used by CT manufacturers as indicators of the radiation produced during the scan. It also provides valuable information when used to the amount of radiation exposure of patients in different age groups.16
Brenner et al.17 put forward that the lifetime CT-attributable cancer death risk for children aged 5 years was approximately 2.5 times higher than the risk for adults aged 30 years in their study. They also compared abdomen and head CT scans and showed that the estimated risks were significantly higher for abdominal CT scans than for head scans.
In the study conducted by Masuda et al.18 they evaluated the radiation dose and image quality in low-tube-voltage pediatric chest computed tomography angiography (CTA) using the standard tube voltage technique. As a result of the study, they found out that the contrast-to-noise ratio (CNR) index was the same in 80 kVp and 120 kVp imaging. Therefore, they concluded that the radiation dose given to infants undergoing chest CT scans could be reduced without deterioration in image quality.
In a study carried out by Khan et al., they concluded that reducing the tube voltage from 120 kVp to 100 kVp can significantly reduce radiation exposure while maintaining good diagnostic imaging quality.14 Karmazyn et al.19 obtained CTDIvol values at various tube voltages using cylindrical water phantoms of different sizes. They also evaluated the effect of patient size on dose and image quality. They suggested that the tube voltage should be reduced from 120 to 80 kVp for infants and 100 kVp for older children.
Wilting et al.20 revealed that radiation dose can be reduced by adjusting the X-ray beam according to patient size. In the study, the higher values obtained from the scans made with 80 mAs-130 kVp (A3, P3) and 100 mAs-130 kVp (A4, P4) are due to the increase in radiation dose by tube current and tube voltage. As seen from PCA and Cluster analysis, it was noted that especially P4 (130 kVp), that is, the CT scan made with 100 mAs-130 kVp, had the highest PC1 loading. It can be concluded that the results obtained from PCA and Cluster analysis have advantages in terms of both qualitative and quantitative presentation and ease of use. Especially in today’s world where machine learning is increasingly gaining attention, it is seen that there are studies conducted with PCA in Radiology as in other fields. Meineke et al.10 used machine learning techniques in dose optimization for CT quality assurance and suggested that it could be a useful tool to simplify CT quality assurance.
The PCA method was used to distinguish benign and malignant solitary pulmonary nodules.21 to verify the relationships between MRI (Magnetic Resonance Imaging) features and gene expression profiles in retinoblastoma, and thus to evaluate the reproducibility of radiogenomics in retinoblastoma.22 and to analyze the effectiveness of medical treatments and changes in radiological imaging before and after treatment.23 Rompado et al.24 applied the cluster analysis technique to information obtained from the CT dose record archive. They detected that cluster analysis can provide a fast and effective overview of the main combinations of exposure parameters and dose indicator distributions, even if the information is not homogeneous.
It has been stated that conversion factors were created to normalize CTDI vol and DLP according to patient size to estimate the actual absorbed doses in CT scans performed with phantoms and that these values are consistent with the 32 cm phantom. Moreover, CTDIvol and DLP should be reported in the studies performed in accordance with the instructions recommended by the manufacturer for the clinical pediatric body protocol. Therefore, using the same phantom provides an advantage in terms of not causing errors when trying to optimize the protocols.25
Limitations
This study has some limitations. These limitations are that the study was conducted with a single CT device and the same phantom was used in the measurements. Moreover, the data was obtained from the dose report page.
Conclusion
Changing the kVp and mAs values affects CTDIvol and DLP values in both adult and pediatric patients. The fact that there was no significant difference between the results in the statistical comparison led to the thought that more attention should be paid to pediatric patients due to their small body structure. The reason is that it can be said that the amount of radiation they are exposed to is higher. In addition, it was concluded that PCA and cluster analysis are also advantageous in terms of ease of use and qualitative assessment. It can be stated that the PCA method will be advantageous and usable in terms of evaluating the compliance of radiation with the standards in scans made on different CT devices used and examining multiple parameters at the same time.
Declarations
Animal and Human Rights Statement
All procedures performed in this study were in accordance with the ethical standards of the institutional and/or national research committee and with the 1964 Helsinki Declaration and its later amendments or comparable ethical standards.
Informed Consent
Not applicable due to the use of phantom models.
Data Availability
The datasets used and/or analyzed during the current study are not publicly available due to patient privacy reasons but are available from the corresponding author on reasonable request.
Conflict of Interest
The authors declare that there is no conflict of interest.
Funding
None.
Abbreviations
ATCM: Automatic tube current modulation
CNR: Contrast-to-noise ratio
CT: Computed tomography
DLP: Dose length product
IR: Iterative reconstruction
PCA: Principal component analysis
SD: Standard deviation
References
- Acikgöz G. Investigating the effects of tube current and tube voltage on patient dose in computed tomography examinations with principal component analysis and cluster analysis: phantom study. Health Phys. 2024;127(4):513-519.
- Shi HM, Sun ZC, Ju FH. Understanding the harm of low-dose computed tomography radiation to the body. Exp Ther Med. 2022;24(2):534. doi:10.3892/etm.2022.11461
- Muhammad NA, Sabarudin A, Ismail N, Karim MKA. A systematic review and meta-analysis of radiation dose exposure from computed tomography examination of thorax-abdomen-pelvic regions among pediatric population. Radiat Phys Chem. 2021;179(2):10914. doi:10.1016/j.radphyschem.2020.109148
- Frush DP. CT dose and risk estimates in children. Pediatr Radiol. 2011;41(suppl 2). doi:10.1007/s00247-011-2098-z
- Ogbole GI. Radiation dose in pediatric computed tomography: risks and benefits. Ann Ib Postgrad Med. 2010;8(2):118-126.
- Racine D, Ryckx N, Ba A, et al. Task-based quantification of image quality using a model observer in abdominal CT: a multicentre study. Eur Radiol. 2018;28(12):5203-5210. doi:10.1007/s00330-018-5518-8
- Rosenstein M. Diagnostic reference levels for medical exposure of patients: ICRP guidance and related ICRU quantities. Health Phys. 2008;95(5):528-534. doi:10.1097/01.hp.0000326331.35187.63
- Røhme LAG, Homme THF, Johansen ECK, et al. Image quality and radiation doses in abdominal CT: a multicenter study. Eur J Radiol. 2024;178:111642. doi:10.1016/j.ejrad.2024.111642
- Nagel HD. CT parameters that influence the radiation dose. In: Tack D, Gevenois PA, eds. Radiation Dose From Adult and Pediatric Multidetector Computed Tomography. 1st ed. Springer; 2007:51-79. doi:10.1007/978-3-540-68575-3_4
- Meineke A, Rubbert C, Sawicki LM, et al. Potential of a machine-learning model for dose optimization in CT quality assurance. Eur Radiol. 2019;29(7):3705-3713. doi:10.1007/s00330-019-6013-6
- Costa AP de A, Choren R, Pereira DA de M, et al. Integrating multicriteria decision making and principal component analysis: a systematic literature review. Cogent Eng. 2024;11(1):1-20. doi:10.1080/23311916.2024.2374944
- Jolliffe IT, Cadima J. Principal component analysis: a review and recent developments. Philos Trans A Math Phys Eng Sci. 2016;374(2065):20150202. doi:10.1098/rsta.2015.0202
- Xiao S, Lu Z, Xu L. Multivariate sensitivity analysis based on the direction of eigenspace through principal component analysis. Reliab Eng Syst Saf. 2017;165(1):1-10. doi:10.1016/j.ress.2017.03.011
- Khan AN, Khosa F, Shuaib W, Nasir K, Blankstein R, Clouse M. Effect of tube voltage (100 vs 120 kVp) on radiation dose and image quality using prospective gating 320-row multidetector computed tomography angiography. J Clin Imaging Sci. 2013;3(4):62. doi:10.4103/2156-7514.124092
- Schindera ST, Winklehner A, Alkadhi H, et al. Effect of automatic tube voltage selection on image quality and radiation dose in abdominal CT angiography of various body sizes: a phantom study. Clin Radiol. 2013;68(2). doi:10.1016/j.crad.2012.10.007
- Chu PW, Kofler C, Haas B, et al. Dose length product to effective dose coefficients in adults. Eur Radiol. 2024;34(4):2416-2425.
- Brenner DJ, Elliston CD, Hall EJ, Berdon WE. Estimated risks of radiation-induced fatal cancer from pediatric CT. AJR Am J Roentgenol. 2001;176(2):289-296. doi:10.2214/ajr.176.2.1760289
- Masuda T, Funama Y, Nakaura T, et al. Radiation dose reduction with a low-tube-voltage technique for pediatric chest computed tomographic angiography based on the contrast-to-noise ratio index. Can Assoc Radiol J. 2018;69(4):390-396. doi:10.1016/j.carj.2018.05.004
- Karmazyn B, Liang Y, Klahr P, Jennings SG. Effect of tube voltage on CT noise levels in different phantom sizes. AJR Am J Roentgenol. 2013;200(5):1001-1005. doi:10.2214/ajr.12.9828
- Wilting JE, Zwartkruis A, van Leeuwen MS, Timmer J, Kamphuis AG, Feldberg M. A rational approach to dose reduction in CT: individualized scan protocols. Eur Radiol. 2001;11(12):2627-2632. doi:10.1007/s003300101039
- Bomhals B, Cossement L, Maes A, et al. Principal component analysis applied to radiomics data: added value for separating benign from malignant solitary pulmonary nodules. J Clin Med. 2023;12(24):7731. doi:10.3390/jcm12247731
- Jansen RW, Roohollahi K, Uner OE, et al. Correlation of gene expression with magnetic resonance imaging features of retinoblastoma: a multicenter radiogenomics validation study. Eur Radiol. 2024;34(2):863-872.
- Hsiao YC, Fang JJ, Huang CT, Liu ZQ, Chang CJ. A three-dimensional morphological assessment for evaluating pre- and postsurgery in cervical laminoplasty. World Neurosurg. 2024;188(40):357-366. doi:10.1016/j.wneu.2024.05.115
- Rampado O, Gianusso L, Nava CR, Ropolo R. Analysis of a CT patient dose database with an unsupervised clustering approach. Phys Med. 2019;60(2):91-99. doi:10.1016/j.ejmp.2019.03.015
- Chu PW, Yu S, Wang Y, et al. Reference phantom selection in pediatric computed tomography using data from a large, multicenter registry. Pediatr Radiol. 2022;52(3):445-452. doi:10.1007/s00247-021-05227-0
Tables
Table 1. Descriptive statistics and comparison results for characteristics by groups
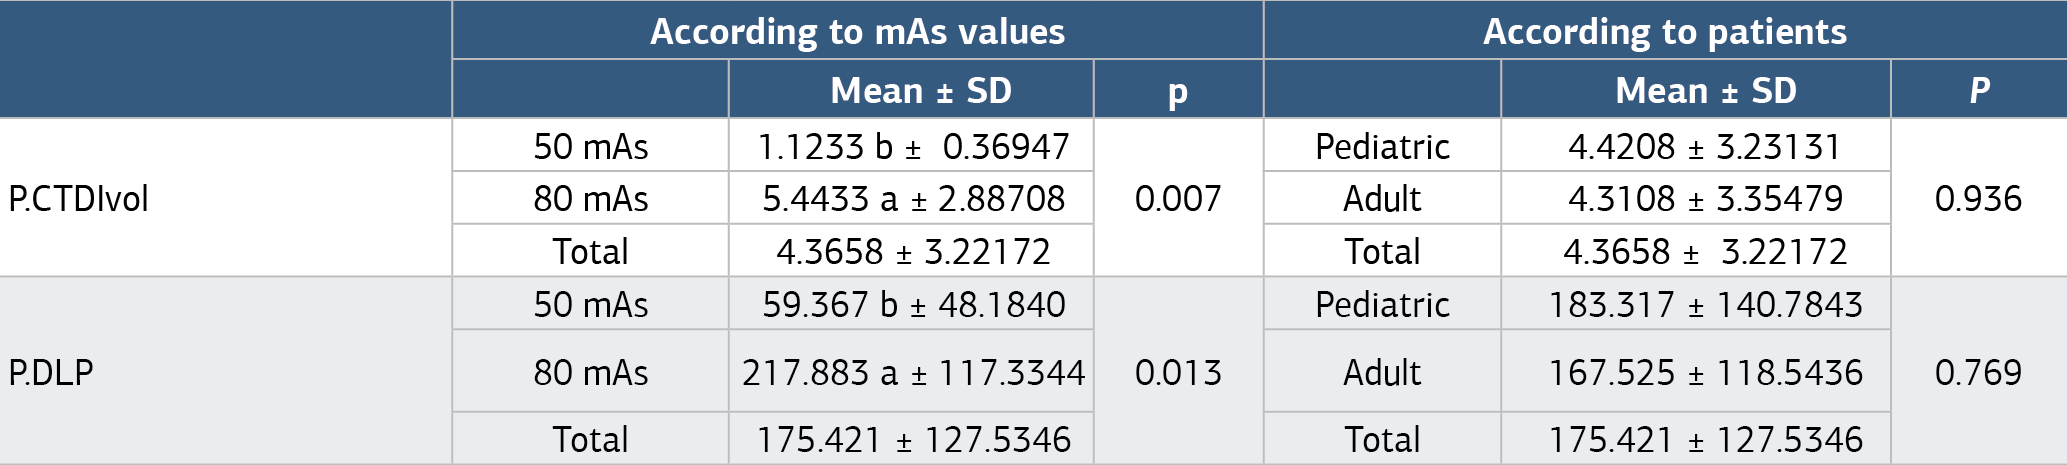
a, b: The differences between means with different letters in the same column are significant (p
Table 2. Comparisons of separate groups in pediatric and adults
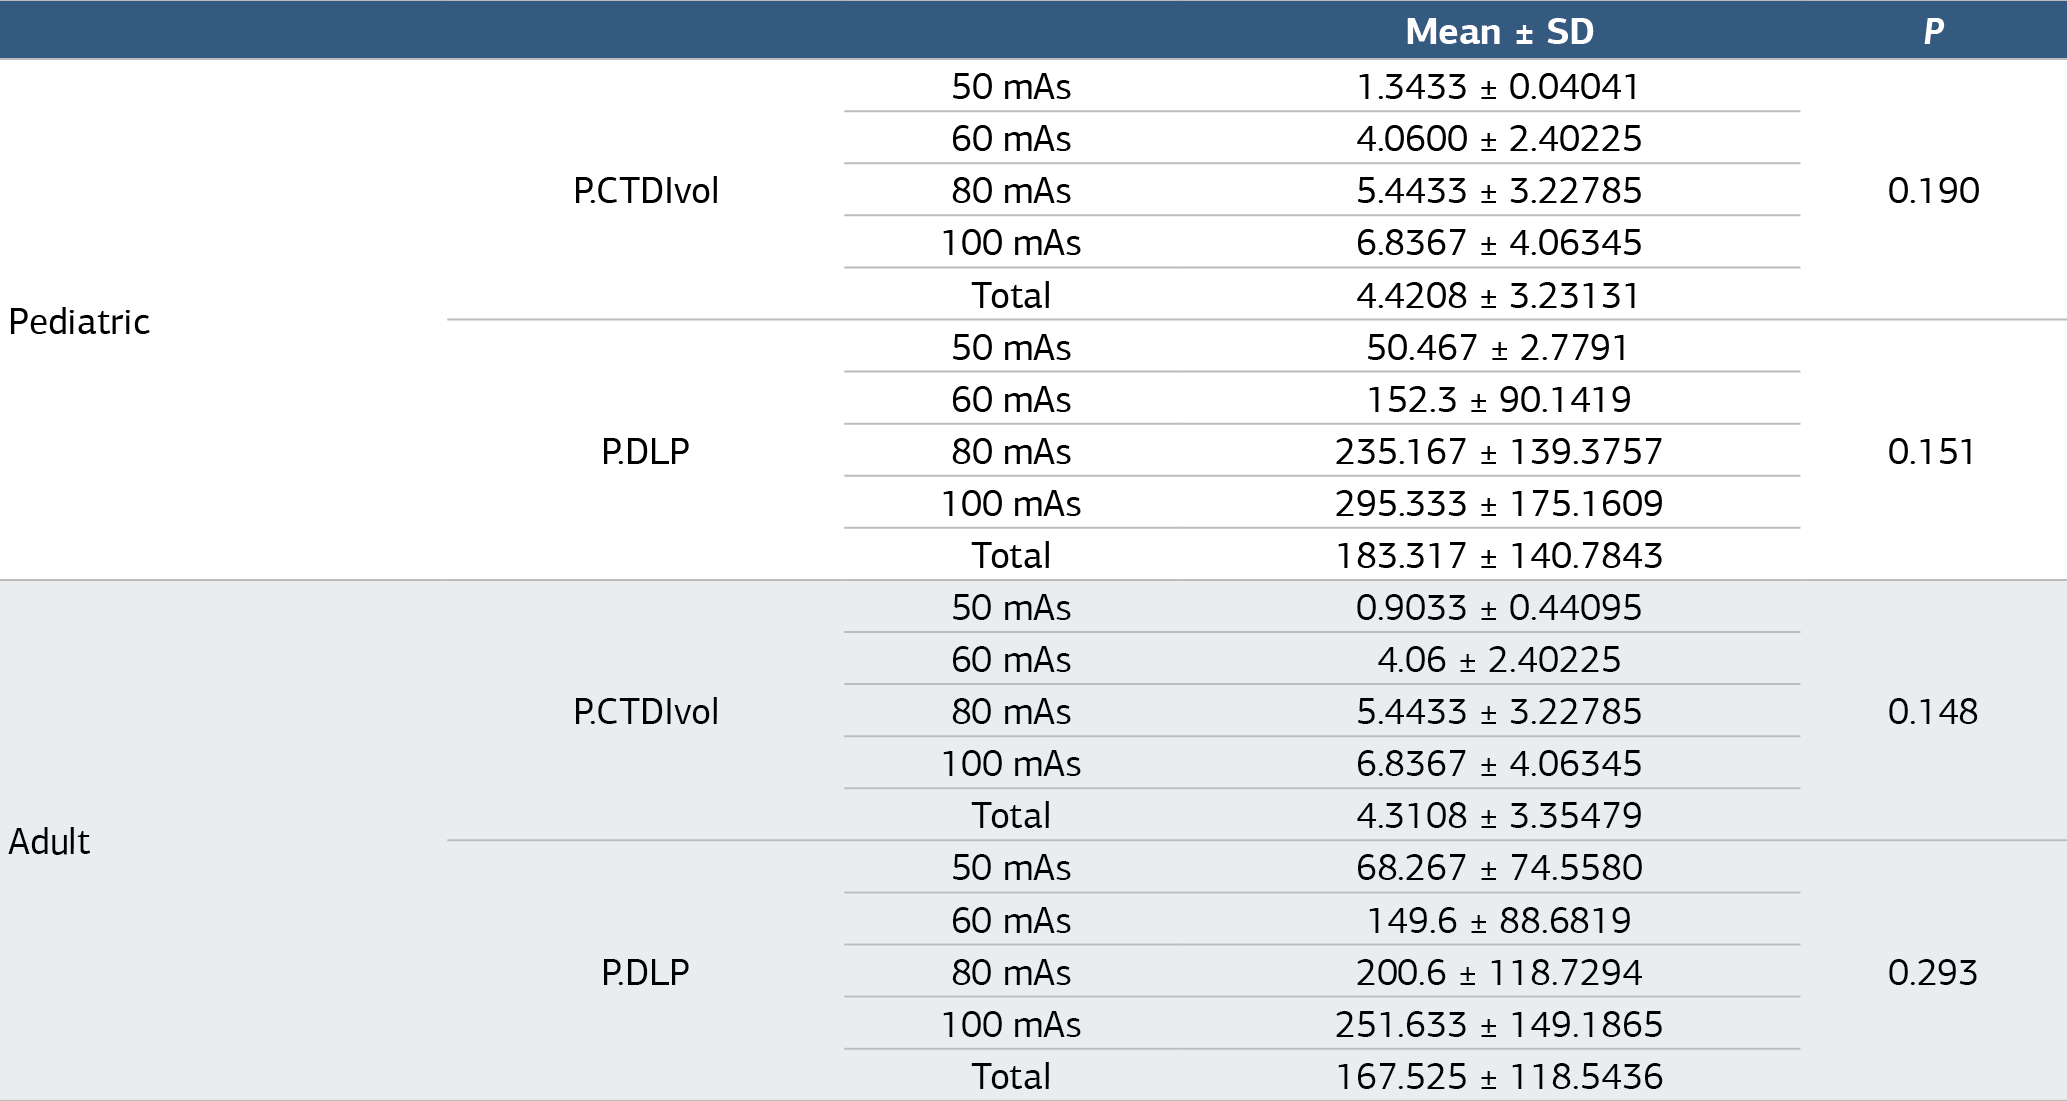
P: Pediatric, CTDIvol = volume CT dose index, DLP = dose-length product
Table 3. Data obtained by PCA and cluster analysis
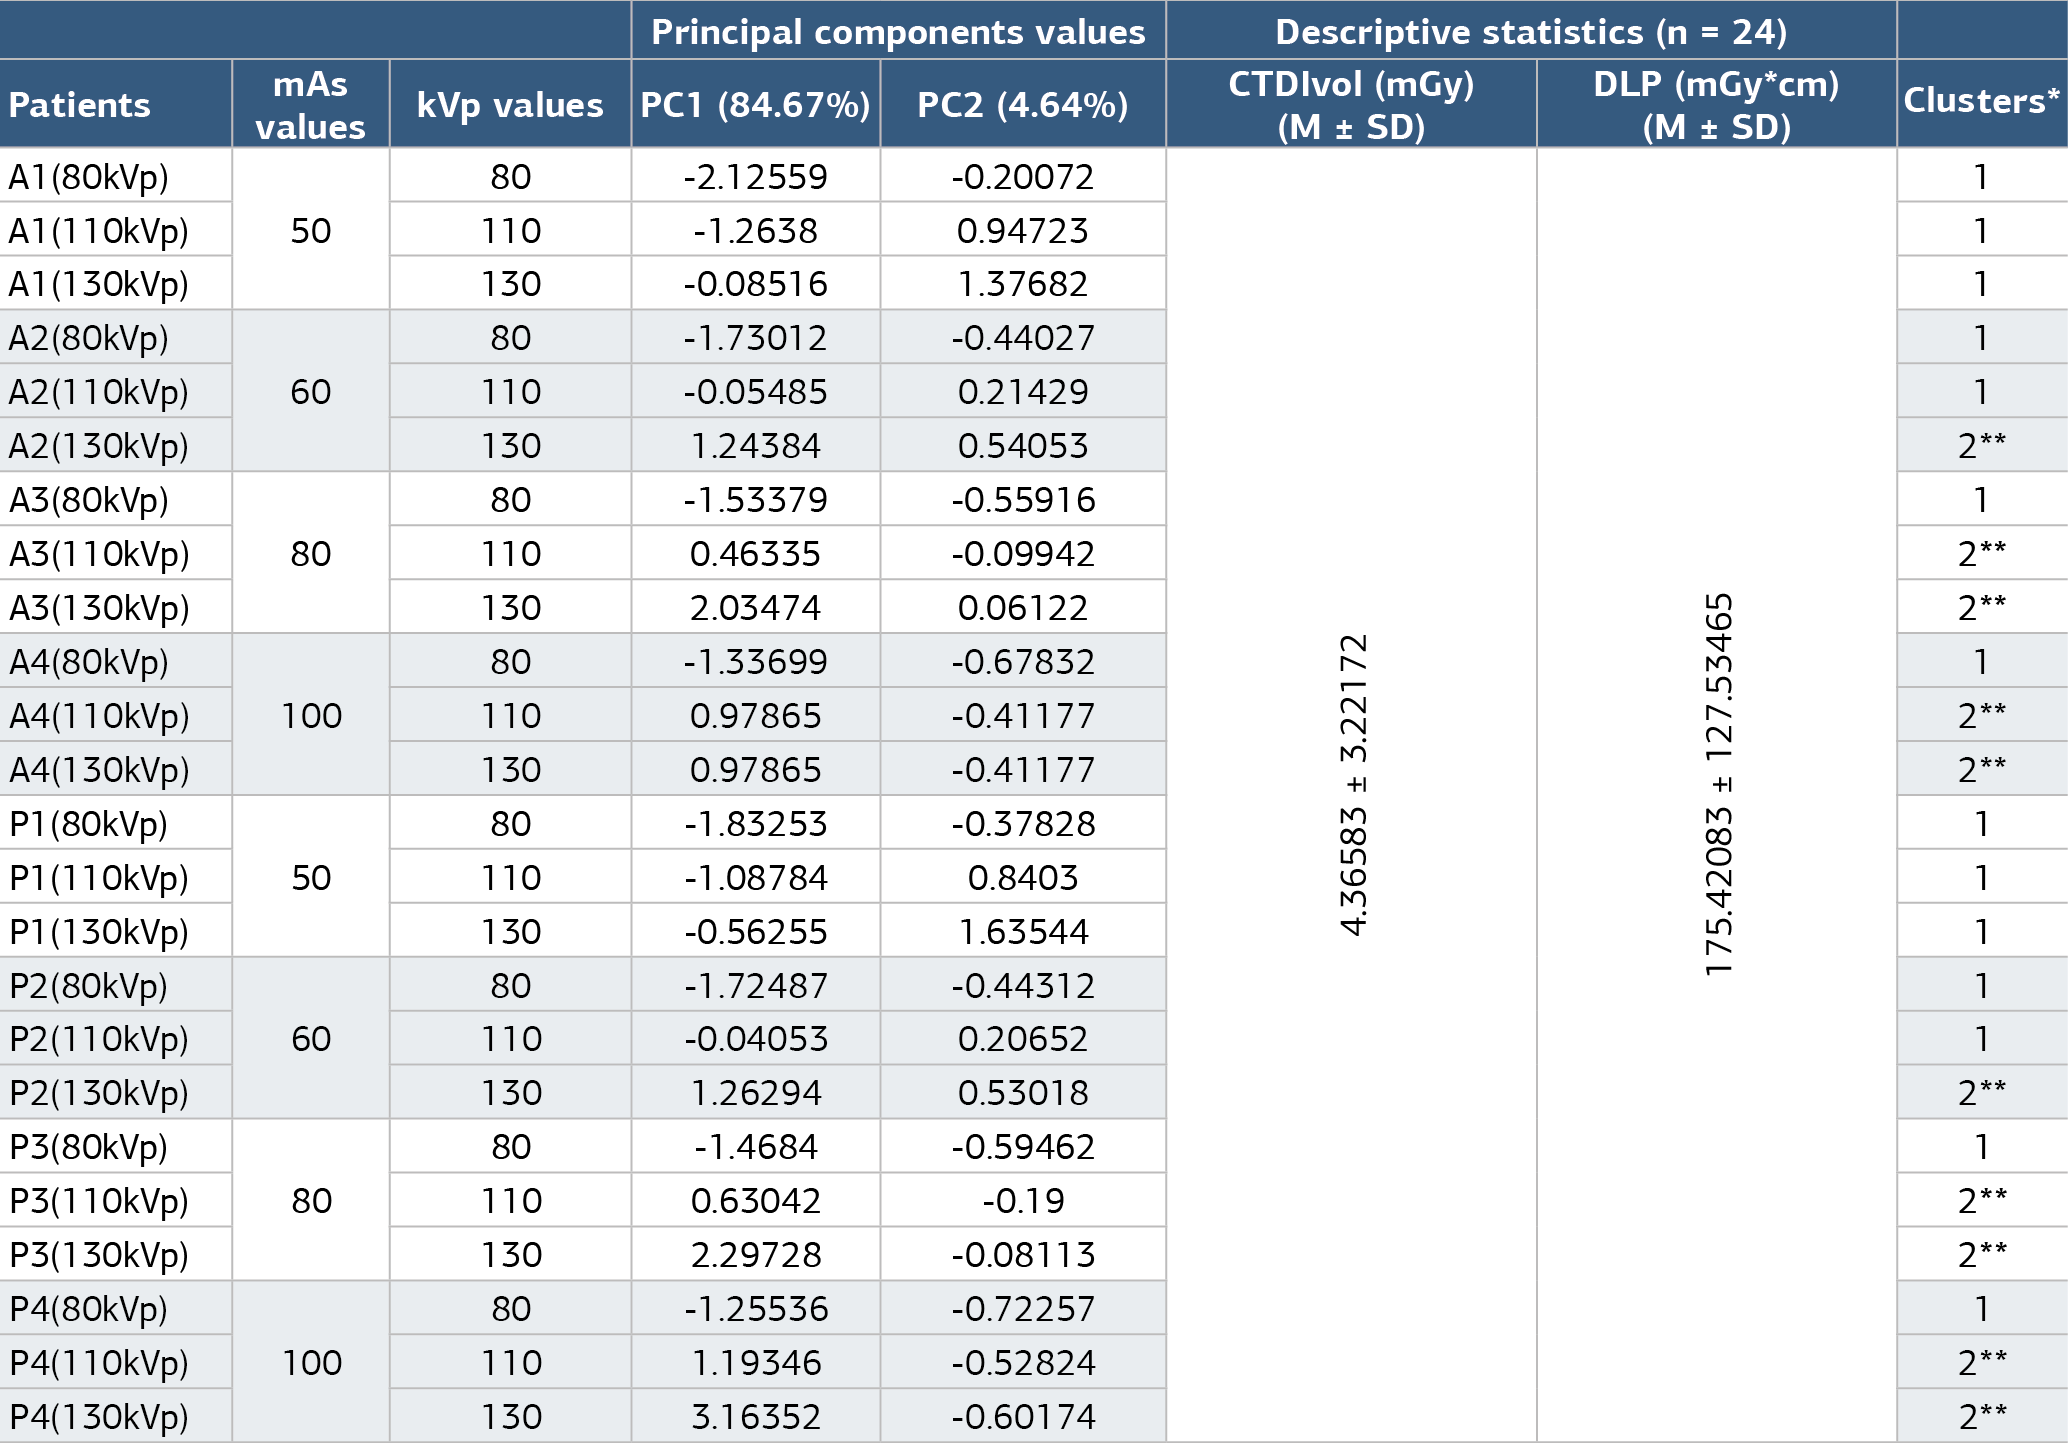
*Clusters determined by PCA and cluster analysis, ** As a result of the analysis, scans obtained with 110 and 130 kVp were classified as group 2
Figures

Figure 1. (a) Siemens Somatom CT scanner, (b) abdomen phantom

Figure 2. The loading plot shows the relationships between variables in PC1 and PC2 space. The value in parentheses indicates the kVp value. Values 1, 2, 3, and 4 represent the data measured at 50, 60, 80, and 100 mAs, respectively. Additionally, A indicates adult abdomen phantom CT scan and the letter P indicates pediatric abdomen phantom CT scans

Figure 3. Cluster analysis; The value in parentheses indicates the kVp value. Values 1, 2, 3, and 4 express the data measured at 50, 60, 80, and 100 mAs, respectively. Additionally, A indicates adult abdomen phantom CT scan and the letter P indicates pediatric abdomen phantom CT scans
Additional Information
Publisher’s Note
Bayrakol MP remains neutral with regard to jurisdictional and institutional claims.
Rights and Permissions

This work is licensed under a Creative Commons Attribution-NonCommercial 4.0 International License (CC BY-NC 4.0). To view a copy of the license, visit https://creativecommons.org/licenses/by-nc/4.0/
About This Article
How to Cite This Article
Güneş Açıkgöz. Effect of tube voltage and tube current in abdominal CT scans with principal components analysis and cluster analysis: phantom study. Ann Clin Anal Med 2025;16(3):197-202. doi:10.4328/ACAM.22560
Publication History
- Received:
- 14.01.2025
- Accepted:
- 17.02.2025
- Published Online:
- 26.02.2025
- Printed:
- 01.03.2025