
Relationship between knee osteoarthritis severity and novel peripheralinflammatory markers
Osteoarthritis and inflammatory markers
Authors
Abstract
AimOsteoarthritis (OA) is a degenerative joint disease influenced by inflammatory processes. This study aimed to investigate the relationship between inflammatory markers and OA severity.
MethodsThis retrospective study included patients aged ≥40 with knee OA, classified using the Kellgren–Lawrence (KL) grading system. Data from 167 individuals were divided into three groups: Group 1 included 50 healthy individuals (KL grade 0), Group 2 comprised 56 with mild OA (KL grades 1–2), and Group 3 included 61 with severe OA (KL grades 3–4). Peripheral inflammation was assessed through hemogram-derived parameters, including platelet-tolymphocyte ratio (PLR), neutrophil-to-lymphocyte ratio (NLR), lymphocyte-to-monocyte ratio (LMR), platelet-to-neutrophil ratio (PNR), neutrophil-lymphocyteplatelet ratio (NLPR), systemic immune response index (SIRI), systemic immune inflammation index (SII), and systemic inflammation aggregate index (SIAI).
ResultsDemographic characteristics were similar across groups (p > 0.05). Neutrophil count, monocyte count, NLR, LMR, PNR, NLPR, SII, SIRI, and SIAI showed significant differences (p<0.05). PNR and SIRI values differed significantly among the three groups across all pairwise comparisons. SIRI exhibited a weak positive correlation with KL grades (r = 0.240, p=0.009), while PNR showed a weak negative correlation (r = -0.273, p=0.003). ROC (Receiver Operating Characteristic) analysis showed moderate discriminatory power for SIRI and PNR with AUCs (Area Under the Curve) of 0.762 and 0.740, respectively.
ConclusionThis study indicates a potential link between OA and systemic inflammation. SIRI and PNR may be useful markers for assessing OA severity.
Keywords
Introduction
For a long time, osteoarthritis (OA) was primarily regarded as a degenerative condition affecting cartilage. However, growing evidence now suggests that inflammation is pivotal in the disease’s pathogenesis.1 Recent research has demonstrated that inflammation may be associated with both the progressive breakdown of cartilage and the manifestation of symptoms such as pain, synovial swelling, palpable joint swelling, and the development of OA. It was indicated that cytokines in the knee joint originate from the systemic circulation and locally, as the cartilage, synovium, or infrapatellar fat can serve as a source.2 Moreover, a study published in 2023 suggested that the development and progression of OA in patients with Parkinson’s disease (PD) may be associated with chronic inflammation.3 While the evidence supporting chronic systemic inflammation in OA pathogenesis continues to grow, the literature remains inconsistent. Several studies have examined specific inflammatory markers for their potential in assessing OArelated inflammation. For instance, studies in recent years have shown that markers such as NLR and PLR may not effectively indicate low-grade inflammation in knee OA.4,5 Additionally, findings from a 2023 study suggest no significant correlation between SII and either radiographic grading or functional outcomes in knee OA.6 These results imply that conventional markers, such as NLR and PLR, may not fully capture the complex inflammatory profile of knee OA, and highlight the need for alternative, cost-effective markers that can assist in monitoring OA progression and prognosis.
This retrospective study investigated the relationship between OA severity and inflammatory markers derived from hemogrambased parameters, which reflect low-grade inflammation, alongside radiographic imaging. Our study aimed to identify a potential alternative marker for assessing OA diagnosis and severity by examining these relationships.
Materials and Methods
Study Design and ScopeThis retrospective study was conducted at the Rheumatology and Physical Medicine and Rehabilitation Clinics of Mersin City Training and Research Hospital, using patient data collected between July 1, 2023, and September 30, 2024. A total of 167 participants over the age of 40, who were examined for knee OA, had anteroposterior and lateral knee X-rays taken at the time of their visit, and had available hemogram results, were included in the study.
In this study, the diagnosis of knee OA was based on radiographic findings using the KL classification, a widely accepted tool for grading OA severity.7 Although clinical symptoms were not directly included due to the retrospective design, patient files, previous radiological imaging, laboratory parameters, International Classification of Diseases, 10th Revision (ICD10) codes, and medication history (to the extent available or accessible) were reviewed to ensure accurate OA diagnosis and to exclude systemic or inflammatory joint diseases.
The participants were categorized into three groups according to their KL grades: Group 1 consisted of 50 healthy individuals (KL grade 0), Group 2 comprised 56 patients with lower KL grades (grades 1 and 2), and Group 3 comprised 61 patients with higher KL grades (grades 3 and 4).
Exclusion criteria included OA related to trauma (e.g., fractures or dislocations identified through ICD-10 diagnosis codes or imaging methods) or infection (e.g., septic arthritis or osteomyelitis), systemic inflammatory disease, systemic infectious disease, pregnancy, malignancy, and the use of medications that could affect platelet, neutrophil, or lymphocyte counts. Additionally, if identified, patients within 6 weeks of recovery from acute infectious conditions such as influenza or enteritis were also excluded.
Assessment of OA SeverityRadiographic grading of gonarthrosis was performed using the KL score: Grade 0 (no detectable signs of OA on X-ray), Grade 1 (possible joint space narrowing (JSN) and slight osteophyte development), Grade 2 (clearly visible osteophytes with probable JSN), Grade 3 (definite JSN, numerous osteophytes, bone sclerosis, and potential bone distortion), and Grade 4 (prominent osteophytes, severe JSN, significant bone sclerosis, and clear bone distortion).7
Determination of InflammatoryParameters Peripheral inflammation in this study was evaluated using hemogram-derived parameters, including PLR, NLR, LMR, and PNR. Additionally, SIRI was determined based on the formula: neutrophil count * monocyte count/lymphocyte count. SII was determined using the following equation: NLR * platelet count. SIAI was computed as follows: neutrophil count * monocyte count * platelet count/lymphocyte count. NLPR was derived from the following equation: neutrophil count * 100 / lymphocyte count * platelet count.8,9
Ethical ApprovalThis study was approved by the Ethics Committee of Mersin University (Date: 16.10.2024, Decision No: 988).
Statistical AnalysesAll analyses were performed using IBM SPSS Statistics version 22.0, with a significance threshold set at p<0.05. Data distributions were initially examined using the ShapiroWilk test. Continuous variables were presented as mean ± standard deviation (SD) for normally distributed data or as median (minimum–maximum) for non-normally distributed data. Categorical variables were expressed as frequencies and percentages. Group comparisons used One-Way ANOVA or Kruskal-Wallis H Test, with post-hoc tests for significant results. Pearson’s Chi-Square Test was used for categorical variables. Spearman’s correlation coefficient (r) was used to evaluate the association between KL grade and laboratory parameters. Correlation strength was interpreted as follows: very weak (r < 0.20), weak (0.20–0.39), moderate (0.40–0.59), strong (0.60–0.79), and very strong (r ≥ 0.80).10 Receiver Operating Characteristic (ROC) curve analyses were conducted to assess the diagnostic performance of SIRI and PNR for OA diagnosis and severity.
Reporting GuidelinesThe study was reported in accordance with STROBE guideline.
Results
A total of 167 participants were divided into three groups: 50 healthy (KL 0), 56 with mild OA (KL 1–2), and 61 with severe OA (KL 3–4). Demographic characteristics, including age and gender, were similar across the three groups (p > 0.05) (Table 1). Laboratory parameters such as platelet count, lymphocyte count, and PLR were also similar among the groups (p > 0.05). In contrast, certain laboratory parameters such as neutrophil count, monocyte count, NLR, LMR, PNR, NLPR, SII, SIRI, and SIAI showed significant differences between the groups. NLR and SIAI values in Group 2 and Group 3 were statistically similar to each other but significantly higher than those in Group 1 (p=0.002 and p<0.001, respectively). LMR, SII, and NLPR values were statistically different between Group 1 and Group 3, but no significant differences were observed between Group 1 and Group 2 or Group 2 and Group 3 (p<0.001, p=0.025, and p=0.001, respectively). Neutrophil count, PNR, and SIRI values differed significantly across all pairwise group comparisons (p<0.001 for each parameter). Monocyte count in Groups 1 and 2 was statistically similar but significantly lower than in Group 3 (p<0.001) (Table 1). The study’s findings indicate a weak positive correlation between SIRI and KL grade (r = 0.240, p=0.009). In contrast, PNR demonstrated a weak negative correlation with KL grade (r = -0.273, p=0.003) (Table 2).
The scatter plot demonstrates a weak positive correlation between SIRI and KL grade, with SIRI values showing a slight increase as KL grade progresses (Figure 1A). The scatter plot illustrates a weak inverse relationship between PNR and KL grade, with PNR values tending to decline progressively as KL grade advances (Figure 1B).
In differentiating between OA and healthy controls, the ROC analysis for SIRI (Figure 2A) demonstrated an AUC of 0.762, with a p-value of < 0.001 and a 95% confidence interval ranging from 0.682 to 0.842. For the PNR (Figure 2B), the ROC analysis revealed an AUC of 0.740, with a p-value of < 0.001 and a 95% confidence interval ranging from 0.658 to 0.823.
In distinguishing between high and low grades of OA, the ROC analysis for SIRI revealed an AUC of 0.635, with a p-value of 0.012 and a 95% confidence interval ranging from 0.534 to 0.736 (Figure 3A). In differentiating between high and low grades of OA, the ROC analysis for PNR yielded an AUC of 0.655, with a p-value of 0.004 and a 95% confidence interval ranging from 0.554 to 0.756 (Figure 3B).
Discussion
This study identified significant differences in some inflammatory markers between OA patients and healthy controls, with significant associations between KL grade and these inflammatory markers. SIRI showed a weak positive correlation with KL grade, suggesting increased systemic inflammation with OA severity, while PNR had a weak negative correlation, indicating its decline with severity. ROC analysis demonstrated the moderate discriminatory power of SIRI and PNR in diagnosing OA and assessing its progression.
Emerging evidence from recent studies increasingly supports the view that alterations in inflammatory factors are closely associated with the development and progression of OA.3,11 Uysal et al.’s 2023 study examined the link between inflammation and OA in PD patients, considering the impact of balance deterioration over time. The findings indicated that chronic systemic inflammation in PD patients is associated with the onset and progression of OA. Specifically, PD patients showed elevated CRP and NLR levels compared to healthy individuals, suggesting the presence of low-grade chronic inflammation. In the early stages of PD, patients showed thicker distal femoral cartilage (DFCT) than healthy controls, probably due to cartilage swelling or edema, a potential marker of early OA. The study accounted for balance, demonstrating that OA development in the early stages of PD was independent of balance issues, as balance was preserved in the early stages of PD. However, as PD advanced, cartilage thickness decreased, and balance deteriorated, indicating OA progression in later stages, which may result from both chronic inflammation and worsening balance levels.3
Under conditions of inflammation and stress, neutrophil and platelet counts increase, while lymphocyte levels tend to decrease.5,12 The observed increase in monocyte levels may result from the progression of immune responses. Monocytes are activated through inflammasome-mediated pathways, and chronic low-grade activation of the inflammasome is thought to contribute to OA progression. In contrast, the reduction in lymphocyte counts may reflect their migration to zones of inflammation.13,14 Gao et al. showed that patients with knee OA had higher MLR, NLR, and PLR values compared to the control group and indicated that the MLR and NLR act as reliable indicators of knee OA severity.13
Some studies have reported that elevated blood NLR and PLR levels are associated with knee OA.15,16 however, other studies have found no significant increase in these markers.4,5 A systematic review and meta-analysis identified an association between both NLR and PLR with the presence of OA and showed that only NLR demonstrated a correlation with disease severity.17 Zhang et al. reported that NLR, PLR, and SII were positively associated with an increased risk of OA, whereas LMR was inversely associated with OA risk. Moreover, they reported that while NLR was linked to an increased risk of overall OA, no statistical correlation was found with the risk of knee OA.18 Salamanna et al. suggested that an elevated PLR is linked to a greater probability of moderate to severe OA and that tracking this biomarker could support early identification and effective management of OA severity.19 In our study, NLR values in both mild and severe OA patient groups were higher compared to the control group. Additionally, SII values were higher in the severe OA patient group than in the control group. In contrast to the findings of Salamanna et al.19 our study showed that PLR was similar among the groups. These discrepancies across studies could be attributed to differences in study design, patient populations, sample sizes, and methodologies used to assess inflammatory markers. Additionally, factors such as the stage of OA, the presence of comorbidities, variations in local and systemic inflammatory responses, and the status of smoking or Non-Steroidal AntiInflammatory Drugs (NSAIDs) use might contribute to these inconsistent findings. However, LMR was identified as being inversely associated with OA risk in our study, similar to the findings in the study by Zhang et al.18
Additionally, data on the association between SIRI and OA risk remain limited, whereas the relationship between PNR, a novel inflammatory marker, and the risk of OA has not been previously reported. However, PNR has proven highly effective in identifying and predicting other inflammation-associated disorders.
For example, PNR has been found to inversely correlate with the severity of systemic inflammatory skin diseases.20 Liu et al. observed that PNR levels were reduced in patients with lupus nephritis who did not have an infection, compared to levels in healthy controls.21 Wei et al. observed that NPR (inverse of P/N) levels were elevated in patients with infective endocarditis, a condition characterized by inflammation of the endocardium and heart valves. Additionally, they found that elevated NPR was associated with both in-hospital and long-term mortality in these patients.22 However, until now, the potential of PNR to predict knee OA has not been investigated. In the present study, PNR values differed significantly across all pairwise group comparisons. Specifically, PNR values were higher in the control group compared to both the mild and severe OA groups. Additionally, a negative correlation was observed between KL grade and PNR, indicating that PNR decreased progressively as OA severity increased. ROC analysis further demonstrated the predictive value of PNR in differentiating between OA severity levels and healthy controls.
Xue et al. found a significant positive relationship between OA and SIRI and suggested that both SII, particularly at higher levels and SIRI may act as valuable markers in OA research, underscoring the need for further investigation in this field.11 Another study suggested that SIRI is an innovative and accessible inflammatory marker that may aid in predicting OA risk in adults.23 In our study, SIRI values differed significantly across all pairwise group comparisons, with the highest values observed in the severe OA group and the lowest in the control group. Furthermore, SIRI levels were positively correlated with KL grade, while PNR levels demonstrated a negative correlation with KL grade. This evidence highlights the potential role of these markers in assessing OA diagnosis and severity.
Limitations
The retrospective design and the small sample size were the primary limitations of our study. Additionally, the study lacked data on body mass index, smoking habits, and comorbidities, which are known to influence inflammatory markers.24,25 Due to the retrospective nature of the study, data on treatments like NSAIDs were limited, which may affect inflammatory markers. Another limitation of the study was the exclusion of well-established markers of systemic inflammation, such as erythrocyte sedimentation rate (ESR) and C-reactive protein (CRP).
Conclusion
Elevated SIRI and decreased PNR levels in the mild osteoarthritis group compared to the healthy group, as well as their progressive changes in the severe osteoarthritis group, highlight a relationship between systemic inflammation and OA severity. While these results suggest that SIRI and PNR may hold potential in assessing OA severity, the limited data on their predictive role underscores the need for further investigation to clarify their utility in identifying the diagnosis and severity of OA.
Declarations
Animal and Human Rights Statement
All procedures performed in this study were in accordance with the ethical standards of the institutional and/or national research committee and with the 1964 Helsinki Declaration and its later amendments or comparable ethical standards.
Informed Consent
Because of the retrospective design, informed consent was not required.
Data Availability
The datasets used and/or analyzed during the current study are not publicly available due to patient privacy reasons but are available from the corresponding author on reasonable request.
Conflict of Interest
The authors declare that there is no conflict of interest.
Funding
None.
Abbreviations
KL: Kellgren-Lawrence
LMR: Lymphocyte-to-monocyte ratio
NLR: Neutrophil-to-lymphocyte ratio
NLPR: Neutrophil-to-lymphocyte-to-platelet ratio
OA: Osteoarthritis
PLR: Platelet-to-lymphocyte ratio
PNR: Platelet-to-neutrophil ratio
ROC: Receiver operating characteristic
SIAI: Systemic inflammation aggregate index
SII: Systemic immune-inflammation index
SIRI: Systemic immune-response index
References
-
Robinson WH, Lepus CM, Wang Q, Raghu H, Mao R, Lindstrom TM, et al. Low-grade inflammation as a key mediator of the pathogenesis of osteoarthritis. Nat Rev Rheumatol. 2016;12(10):580-592. doi:10.1038/nrrheum.2016.136
-
Richter M, Trzeciak T, Owecki M, Pucher A, Kaczmarczyk J. The role of adipocytokines in the pathogenesis of knee joint osteoarthritis. Int Orthop. 2015;39:1211-1217. doi:10.1007/s00264-015-2707-9
-
Uysal A, Guntel M, Demetgül Ö, Çiçek U. Ultrasonographic evaluation of the distal femoral cartilage thickness in Parkinson’s patients. J Musculoskelet Neuronal Interact. 2023;23(3):328-337.
-
Atar E, Askin A. Evaluation of neutrophil-lymphocyte ratio, platelet-lymphocyte ratio and mean platelet volume in patients with knee osteoarthritis. Cukurova Med J. 2017;42(2):329-336.
-
Bakılan F, Ortanca B. The relation between vitamin D, severity of knee osteoarthritis, and inflammatory parameters. Relation. 2022;28(1):6-10. doi:10.4274/tod.galenos.2021.66934
-
Karpuz S, Yılmaz R, Özkan M, Tunçez İH, Kalaoğlu E, Yılmaz H. Is there any correlation between the systemic immune inflammatory index and disease severity in knee osteoarthritis? Genel Tip Derg. 2023;33(3):305-308. doi:10.54005/geneltip.1228775
-
Kellgren JH, Lawrence J. Radiological assessment of osteo-arthrosis. Ann Rheum Dis. 1957;16(4):494-502. doi:10.1136/ard.16.4.494
-
Bao B, Xu S, Sun P, Zheng L. Neutrophil to albumin ratio: a biomarker in non-alcoholic fatty liver disease and with liver fibrosis. Front Nutr. 2024;11:1368459. doi:10.3389/fnut.2024.1368459
-
Zhao X, Huang L, Hu J, Jin N, Hong J, Chen X. The association between systemic inflammation markers and paroxysmal atrial fibrillation. BMC Cardiovasc Disord. 2024;24(1):334. doi:10.1186/s12872-024-04004-9
-
Swinscow TDV, Campbell MJ, eds. Statistics at square one. BMJ; 2002:75-84.
-
Xue Y, Chang C, Chen Y, Jia L, Wang H, Liu Z, et al. Association between the immune-inflammation indicators and osteoarthritis—NHANES 1999-2018. Osteoarthr Cartil Open. 2025;7(1):100453:1-9. doi:10.1016/j.ocarto.2024.100453
-
Ertenli I, Haznedaroğlu I, Kiraz S, Celik I, Çalgiineri M, Kirazli Ş. Cytokines affecting megakaryocytopoiesis in rheumatoid arthritis with thrombocytosis. Rheumatol Int. 1996;16:5-8. doi:10.1007/bf01419947
-
Gao K, Zhu W, Liu W, Ma D, Li H, Yu W, et al. Diagnostic value of the blood monocyte–lymphocyte ratio in knee osteoarthritis. J Int Med Res. 2019;47(9):4413-4421. doi:10.1177/0300060519860686
-
Orlowsky EW, Kraus VB. The role of innate immunity in osteoarthritis: when our first line of defense goes on the offensive. J Rheumatol. 2015;42(3):363-371. doi:10.3899/jrheum.140382
-
Shi J, Zhao W, Ying H, Du J, Chen J, Chen S, et al. The relationship of platelet to lymphocyte ratio and neutrophil to monocyte ratio to radiographic grades of knee osteoarthritis. Z Rheumatol. 2018;77(6):533-537. doi:10.1007/s00393-017-0348-7
-
Hira S, Tamam C. Diagnostic value of hematological parameters in patients with osteoarthritis. Cukurova Med J. 2017;42(1):120-125.
-
Raveendran D, Perry LA, Bucknill A, Liu Z. The significance of neutrophil lymphocyte ratio, platelet lymphocyte ratio, and red cell distribution width in osteoarthritis: a systematic review and meta-analysis. JBJS J Orthop Physician Assist. 2023;11(4):e23. doi:10.2106/jbjs.jopa.23.00014
-
Zhang S, Zhong Y, Wang X, Jiang W, Chen X, Kang Y, et al. Association of peripheral inflammatory indicators with osteoarthritis risk. Osteoarthr Cartil Open. 2024;6(3):100496. doi:10.1016/j.ocarto.2024.100496
-
Salamanna F, Pagani S, Filardo G, Contartese D, Boffa A, Angelelli L, et al. Platelet and lymphocyte-related parameters as potential markers of osteoarthritis severity: a cross-sectional study. Biomedicines. 2024;12(9):2052. doi:10.3390/biomedicines12092052
-
Aiholli S, Adya KA, Inamadar AC. Role of hematological indices as predictors of systemic inflammation in dermatology. Indian Dermatol Online J. 2024;15(2):188-195. doi:10.4103/idoj.idoj_189_23
-
Liu P, Li P, Peng Z, Xiang Y, Xia C, Wu J, et al. Predictive value of the neutrophil-to-lymphocyte ratio, monocyte-to-lymphocyte ratio, platelet-to-neutrophil ratio, and neutrophil-to-monocyte ratio in lupus nephritis. Lupus. 2020;29(9):1031-1039. doi:10.1177/0961203320929753
-
Wei XB, Liu YH, He PC, Yu DQ, Tan N, Zhou YL, et al. The impact of admission neutrophil-to-platelet ratio on in-hospital and long-term mortality in patients with infective endocarditis. Clin Chem Lab Med. 2017;55(6):899-906. doi:10.1515/cclm-2016-0527
-
He Q, Wang Z, Mei J, Xie C, Sun X. Relationship between systemic immune-inflammation index and osteoarthritis: a cross-sectional study from the NHANES 2005–2018. Front Med. 2024;11:1433846. doi:10.3389/fmed.2024.1433846
-
Ma R, Cui L, Cai J, Yang N, Wang Y, Chen Q, et al. Association between systemic immune inflammation index, systemic inflammation response index, and adult psoriasis: evidence from NHANES. Front Immunol. 2024;15:1-14. doi:10.3389/fimmu.2024.1323174
-
Guo L, Huang Y, He J, Li D, Li W, Xiao H, et al. Associations of lifestyle characteristics with circulating immune markers in the general population based on NHANES 1999 to 2014. Sci Rep. 2024;14(1):13444. doi:10.1038/s41598-024-63875-2
Figures
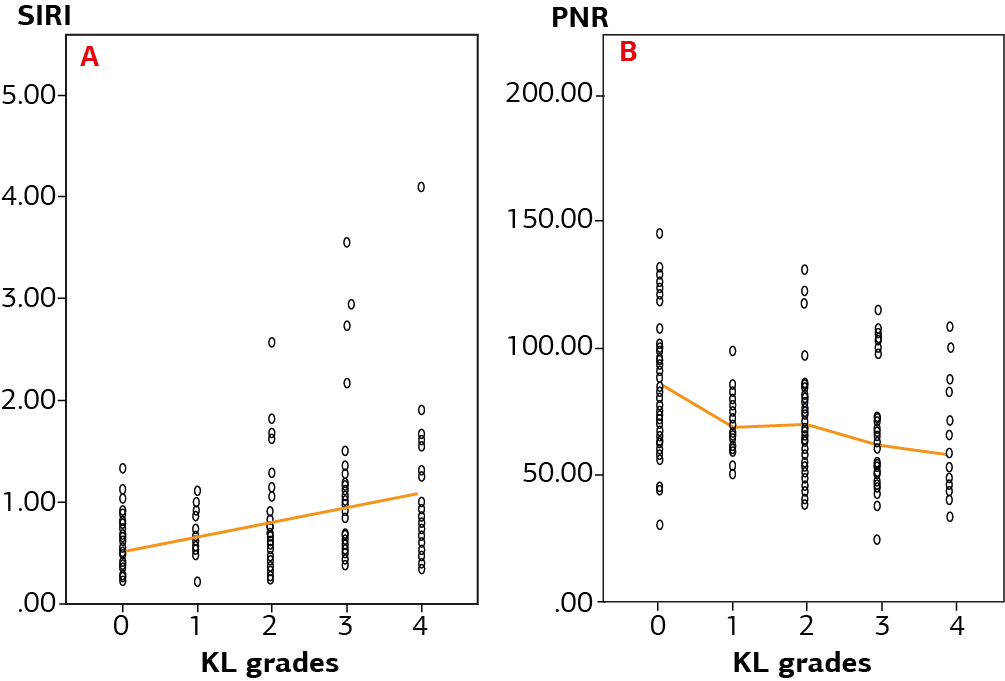
Figure 1. Relationship between SIRI (A), PNR (B), and KL grades. SIRI: Systemic immune-response index, PNR: plateletto-neutrophil ratio, KL: Kellgren–Lawrence

Figure 2. ROC curve analysis of the SIRI (A) and PNR (B) for predicting osteoarthritis. ROC: Receiver Operating Characteristic, SIRI: Systemic immune-response index, PNR: platelet-to-neutrophil ratio

Figure 3. ROC curve analysis of the SIRI (A) and PNR (B) for predicting osteoarthritis severity. ROC: Receiver Operating Characteristic, SIRI: Systemic immune-response index, PNR: platelet-to-neutrophil ratio
Tables
Table 1. Comparison of demographic and inflammatory parameters between groups
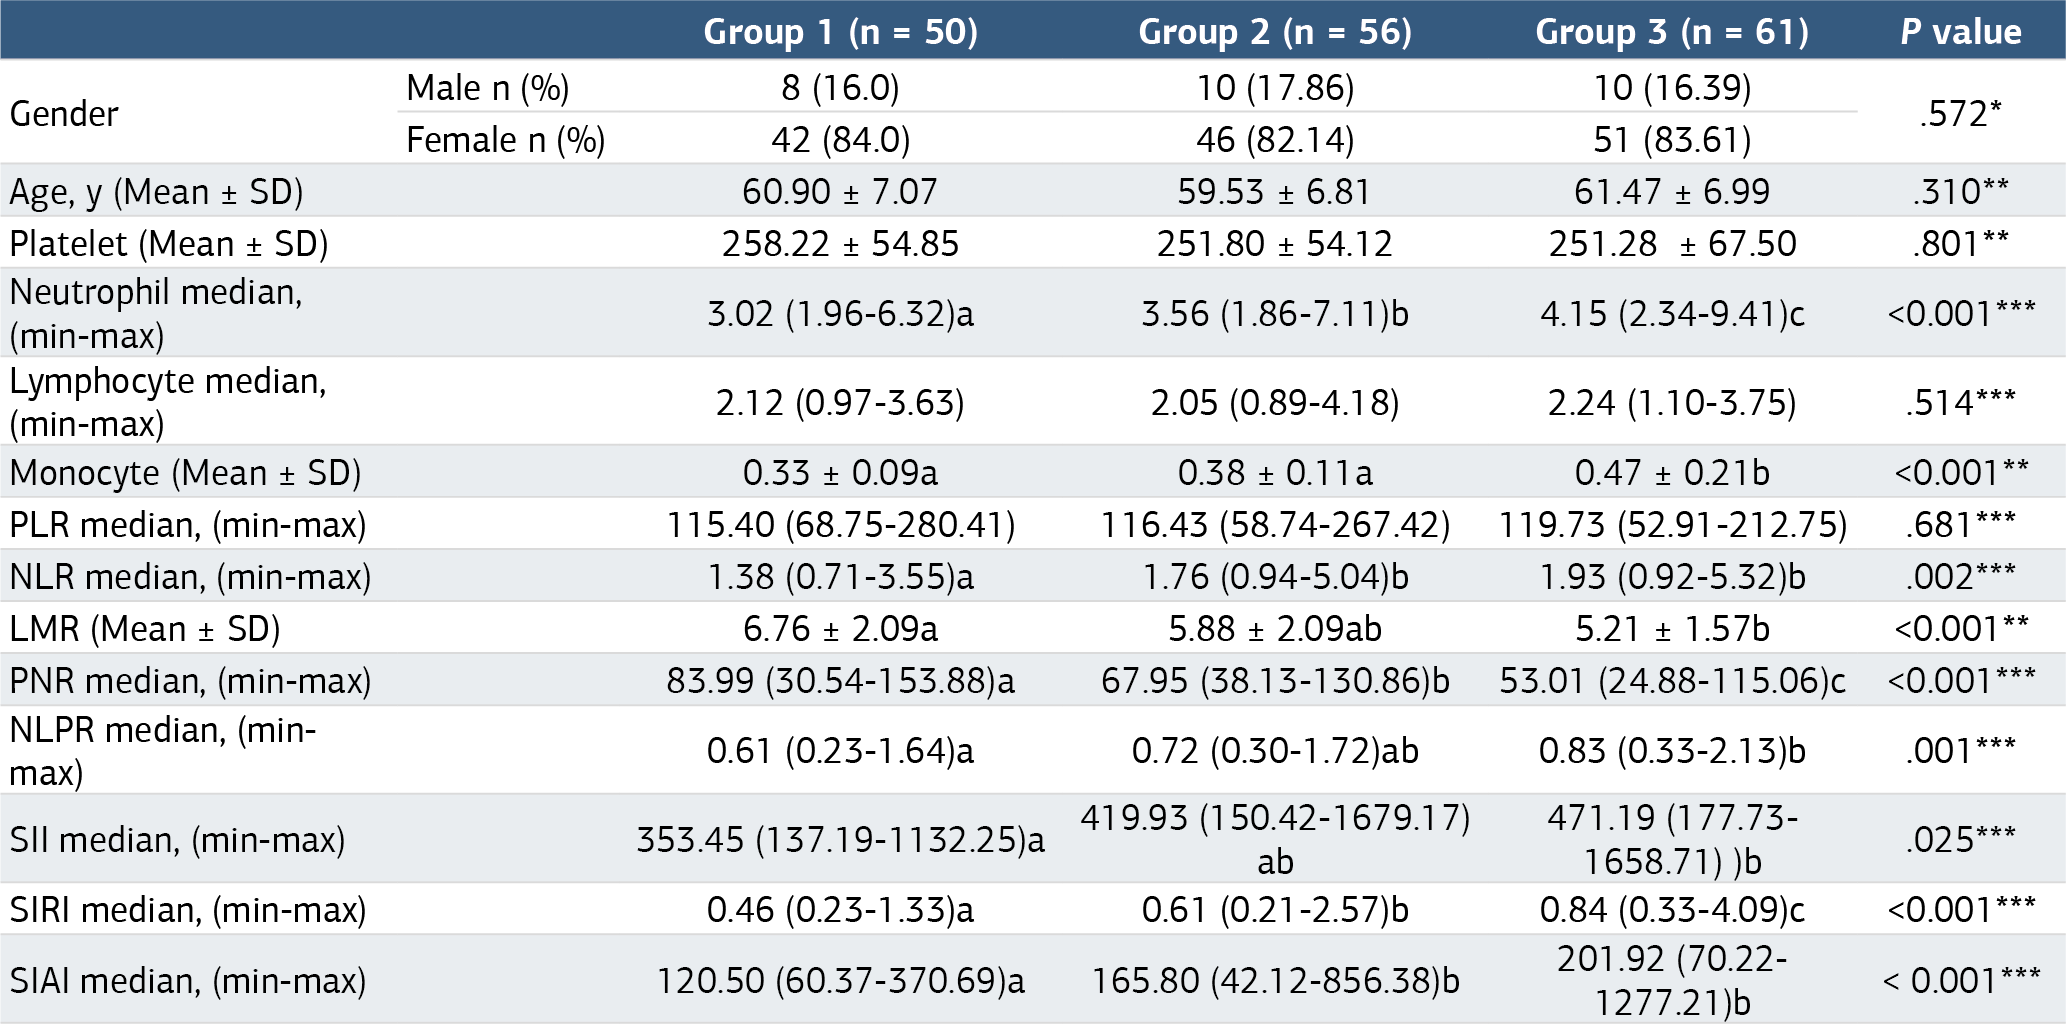
*Pearson Chi-Square Test, ** One-Way ANOVA, *** Kruskal-Wallis H Test n: Number, SD: Standard Deviation, Min: Minimum, Max: Maximum, PLR: Platelet-to-lymphocyte ratio, NLR: Neutrophil-to-lymphocyte ratio, LMR: Lymphocyte-to-monocyte ratio, PNR: Plateletto-neutrophil ratio, NLPR: Neutrophil-to-lymphocyte-to-platelet ratio, SII: Systemic immune-inflammation index, SIRI: Systemic immune-response index, SIAI: Systemic inflammation aggregate index. ****Statistical similarity between values in the same row is indicated by identical superscript letters. If two or more values share at least one common superscript letter, this indicates that there is no statistically significant difference between them.
Table 2. Correlation analysis of laboratory parameters with KL grade

*p<0.05 (statistically significant), **p<0.01 (highly significant), r: Spearman’s correlation coefficient, PLR: Platelet-to-lymphocyte ratio, NLR: Neutrophil-to-lymphocyte ratio, LMR: Lymphocyte-to-monocyte ratio, PNR: Platelet-to-neutrophil ratio, NLPR: Neutrophil-to-lymphocyte-to-platelet ratio, SII: Systemic immune-inflammation index, SIRI: Systemic immune-response index, SIAI: Systemic inflammation aggregate index.
Additional Information
Publisher’s Note
Bayrakol MP remains neutral with regard to jurisdictional and institutional claims.
Rights and Permissions

This work is licensed under a Creative Commons Attribution-NonCommercial 4.0 International License (CC BY-NC 4.0). To view a copy of the license, visit https://creativecommons.org/licenses/by-nc/4.0/
About This Article
How to Cite This Article
Alper Uysal, Uğur Güngör Demir, Ali Nail Demir, Hacer Paksoy Karateke. Relationship between knee osteoarthritis severity and novel peripheralinflammatory markers. Ann Clin Anal Med 2025;16(3):221-226. doi:10.4328/ACAM.22574
- Received:
- January 20, 2025
- Accepted:
- February 20, 2025
- Published Online:
- February 22, 2025
- Printed:
- March 1, 2025