
Abstract
AimAtopic dermatitis is a chronic inflammatory skin disorder with multifactorial pathophysiology, including immune dysregulation, epidermal defects, and environmental triggers. Recent studies suggest an association between atopic dermatitis (AD) and dyslipidemia, driven by systemic inflammation, but this link remains unclear in pediatric populations. MethodsA total of 52 children with AD and 55 healthy controls aged 6–17 were analyzed. Lipid profiles, including total cholesterol, high-density lipoprotein cholesterol, low-density lipoprotein cholesterol, and triglycerides, were compared between groups. Disease severity was assessed using the SCORing Atopic Dermatitis (SCORAD) index. Statistical analyses included t-tests, ANOVA, and chi-square test. ResultsNo significant differences in BMI, age, or socioeconomic factors were observed between groups. AD patients showed slightly higher total cholesterol (4.22 vs. 3.99 mmol/L, P = .057) and low-density lipoprotein cholesterol (2.47 vs. 2.28 mmol/L, P = .097) compared to controls, though these differences did not reach statistical significance. Triglyceride and high-density lipoprotein cholesterol levels were comparable. Lipid levels did not correlate significantly with AD severity. ConclusionWhile trends suggest higher lipid levels in children with AD, no significant associations were identified. Variations across global studies highlight methodological and demographic differences.Keywords
Introduction
Atopic dermatitis (AD) is a chronic, relapsing, and remitting inflammatory dermatosis. It is the most prevalent skin disorder among children. Childhood-onset AD begins early in life, with 50% diagnosed in the first year of life and 85% by 5 years of age.1 The pathophysiology of AD is complex, and there is growing recognition of its heterogeneity.2 The development is influenced by a complex interplay of immune dysregulation, epidermal gene mutations, and environmental factors that disrupt the epidermis, resulting in scaly, erythematous, and intensely pruritic skin lesions. Repeated scratching triggers a self-perpetuating itch-scratch cycle that significantly impacts the patient’s quality of life.3,4
In 2022, the World Health Organization (WHO) released a report stating that 60% of adult Europeans and 1 in 3 children are obese or overweight.5 Epidemiological studies have found that adult eczema may be associated with higher odds of obesity, hypertension, and high cholesterol levels.6 To better understand this potential association, the underlying inflammatory mechanisms should be considered. In obesity, hypertrophic adipocytes secrete high levels of pro-inflammatory adipokines and free fatty acids, leading to inflammation and dyslipidemia.7 Furthermore, elevated triglycerides and low-density lipoprotein cholesterol lead to increased pro-inflammatory signaling and increased expression of TNF-α and interleukin (IL)-6. This supports the interpretation that the presence of a chronic inflammatory state is responsible for chronic skin inflammation; therefore, it provides a possible mechanism for the relationship between atopic dermatitis and hyperlipidemia.8,9
The association between AD and dyslipidemia in children is still unclear.
The aim of this study was to investigate the association between atopic dermatitis and serum lipid profiles in children and to evaluate whether lipid parameters are associated with disease severity.
Materials and Methods
Data Source and Participants The analysis included 52 patients with atopic dermatitis (27 boys and 25 girls) and 55 healthy controls (19 boys and 30 girls); all were 6-17 years old. The group of AD patients was split into three groups based on their SCORing Atopic Dermatitis (SCORAD) index results (<25 mild, 25-50 moderate, >50 severe AD): the severe AD group contained 19 patients, the moderate group 20, and the mild group 13. Measurements Sociodemographic information, including age, sex, and severity of atopic dermatitis, was obtained via face-to-face interviews. Body weight and height were measured by nurses, and Body Mass Index (BMI) was then calculated. The subjects’ BMI values did not differ significantly and were within the normal range according to WHO guidelines. The mean BMI was 19.58 ± 4.76 in the AD group and 18.01 ± 3.36 in the control group. There were no differences in age, gender, weight, or height between the groups. Blood collection procedures were performed by nurses according to the blood-drawing protocol. Serum lipids were measured, and they included Total Cholesterol (TCh), High-density lipoprotein cholesterol (HDL Ch), Low-density lipoprotein cholesterol (LDL Ch), and Triglycerides (Tg). Ethical Approval This study was approved by the Vilnius Regional Biomedical Research Ethics Committee (Date: 25.08.2020, Decision No: 2020/8- 1251-733). Statistical Analysis Statistical analyses were conducted using SPSS software, version 29.0.2.0 (IBM Corp., Armonk, NY, USA). Comparative analyses of lipid panel parameters (TCh, LDL, HDL cholesterol, and Tg) and socioeconomic factors were performed between the AD and control groups. Within the AD group, the SCORAD index and AD severity were analyzed. Independent Samples t-tests were used to compare continuous variables between the groups. Spearman’s Correlation Analysis was used to assess relationships between lipid panel parameters and other variables, including living area and income. Analysis of Variance (ANOVA) was employed to assess variations in TCh levels across different SCORAD severity groups. Chi-square test was used to analyze the distribution of SCORAD severity, living area, and income prevalence. Reporting Guidelines The study was reported in accordance with the STROBE guideline.Results
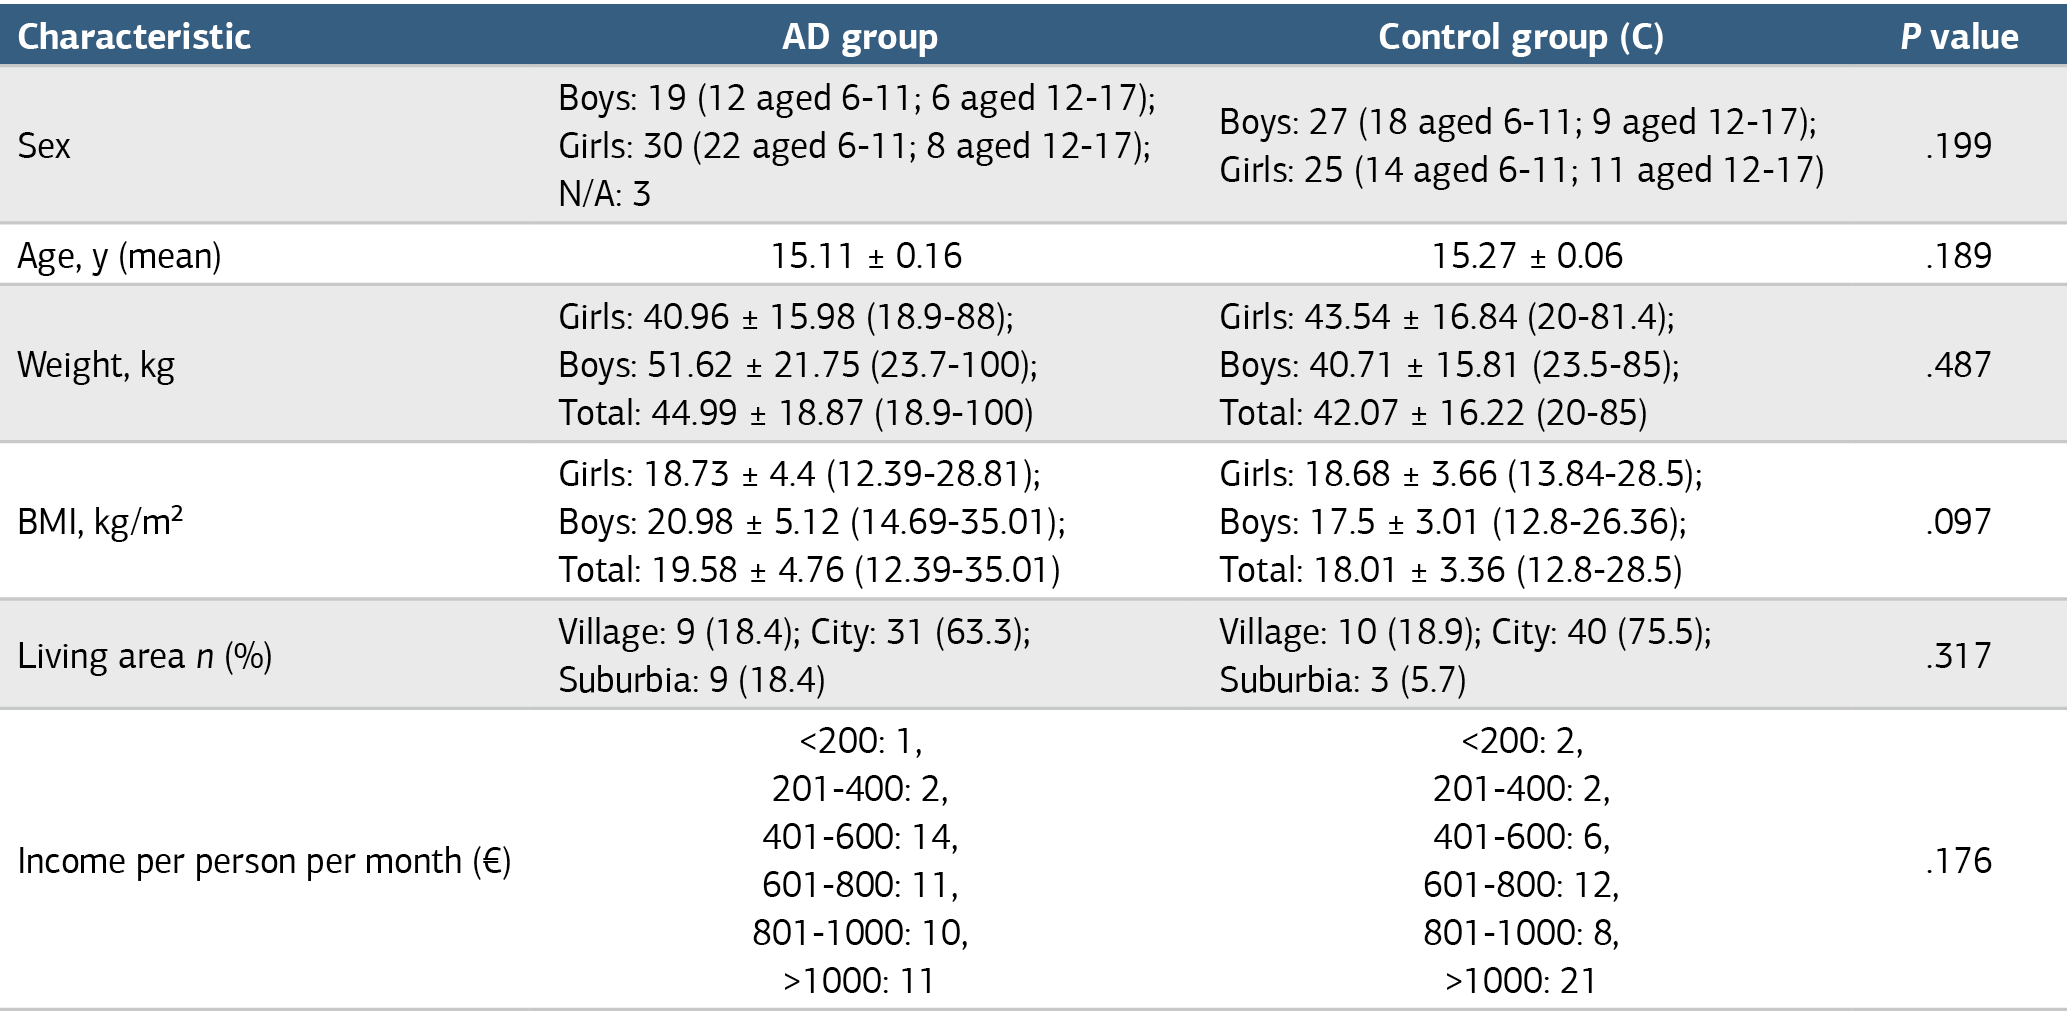
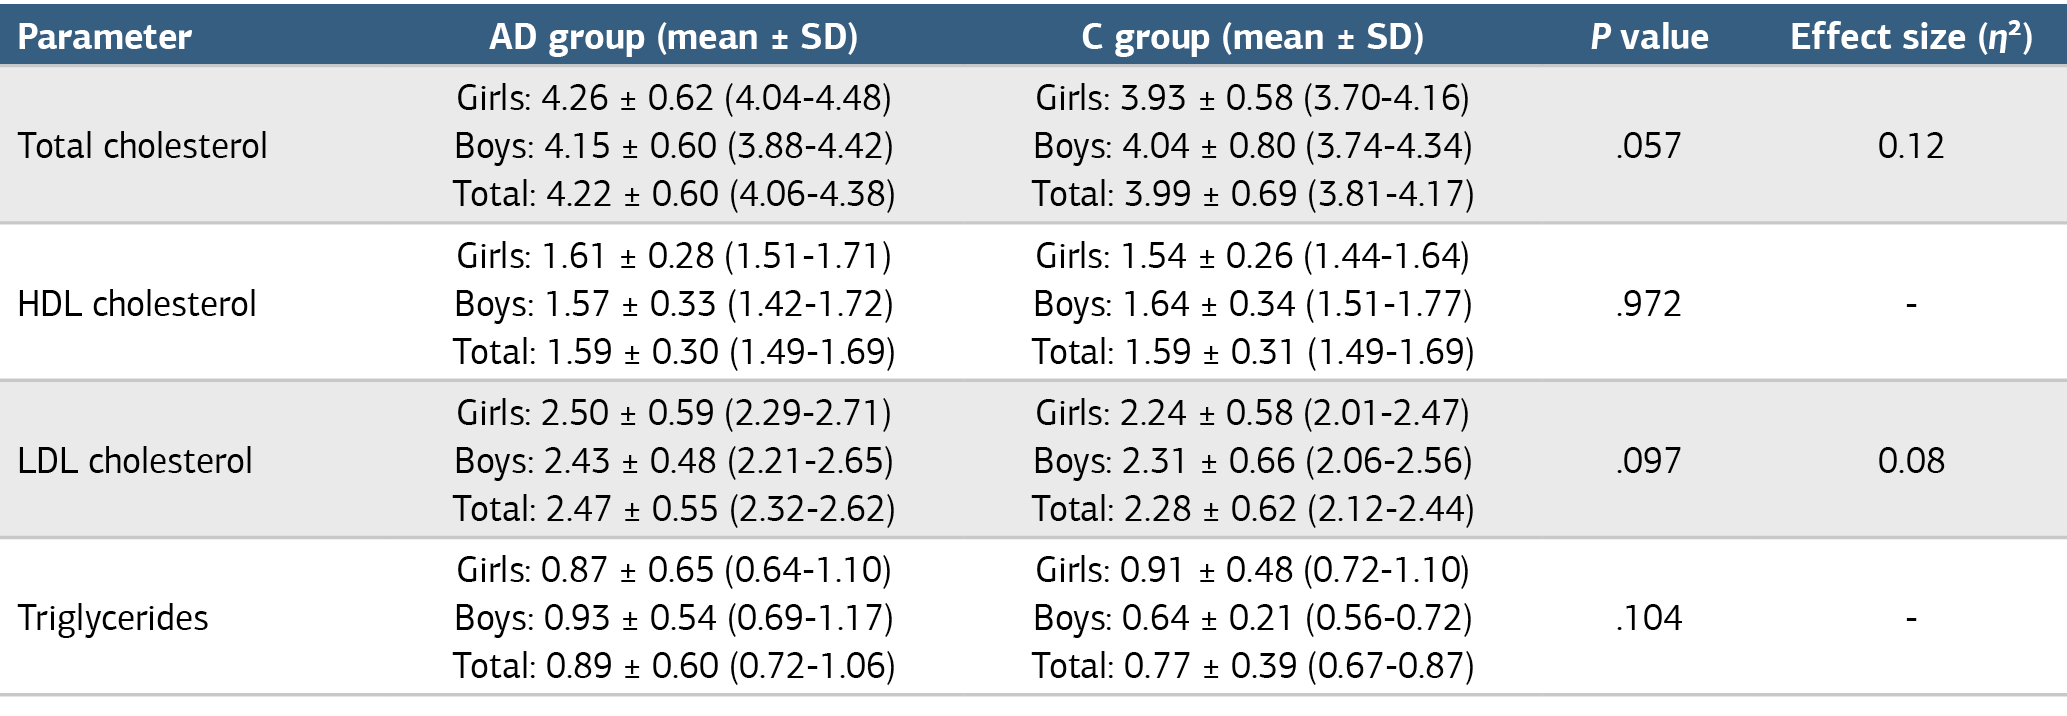
Participant Characteristics The study included 52 patients with atopic dermatitis (AD) and 55 healthy controls (C). The groups were comparable in terms of sex distribution, with the AD group comprising 19 boys and 30 girls and the control group consisting of 27 boys and 25 girls. Three participants in the AD and C group had gender recorded as “N/A.” Age distribution did not differ significantly between the groups (P = .189). The general characteristics of the AD and C groups are shown in Table 1. Anthropometric Data The mean weight was slightly higher in the AD group than in the control group (44.99 ± 18.87 kg vs. 42.07 ± 16.22 kg), although the difference was not statistically significant (P = .487). BMI was also higher in the AD group (mean 19.58 ± 4.76 kg/m²) than in the control group (mean 18.01 ± 3.36 kg/m²), but this difference did not reach statistical significance (P = .097). The confidence interval for the mean difference in BMI was -0.11 to 3.31, supporting the trend toward higher BMI in the AD group (Table 1). Living Area and Socioeconomic Data The distribution of living areas did not differ significantly between the groups (P = .317). Most participants in both groups lived in urban areas (63.3% in AD and 75.5% in the control group). Monthly income per person was categorized into six groups; no significant differences were observed between groups (P = .176). Lipid Panel Results Analysis of lipid profiles revealed the following key findings: • Total cholesterol (TCh) was higher in the AD group (4.22 ± 0.60 mmol/L) than in the control group (3.99 ± 0.69 mmol/L), with a P value of 0.057, although the difference did not reach statistical significance. • LDL cholesterol was higher in the AD group (2.47 ± 0.55 mmol/L) compared to the control group (2.28 ± 0.62 mmol/L; P = .097). • Triglycerides (Tg) and HDL cholesterol showed no statistically significant differences between groups (P = .104 and P = .972, respectively). These findings highlight slight elevations in TCh and MTL Ch levels in the AD group compared to controls, though statistical significance was not reached (detailed information is provided in Table 2). Association Between Lipid Panel and Disease Severity The SCORAD index classified 13 participants as having mild AD, 20 as having moderate AD, and 19 as having severe AD. Total cholesterol levels were highest in the mild group (4.35 ± 0.58 mmol/L) and lowest in the moderate group (4.17 ± 0.59 mmol/L). LDL cholesterol was elevated in all groups, with the highest levels observed in the mild category. Triglycerides increased with severity, from 0.72 ± 0.39 mmol/L in mild AD to 1.02 ± 0.79 mmol/L in severe AD.Discussion
In this study, we did not find any significant relationship between dyslipidemia, obesity, and the severity of atopic dermatitis. Means of Total Cholesterol, LDL Cholesterol, and Triglycerides were higher in the AD group. These findings suggest that although there are observable trends in lipid panel differences between AD and C groups, none of the associations were statistically significant in this sample. We compared our study results with the findings of other studies. Agón-Banzo PJ et al. found that AD patients, especially those with severe AD, had higher serum lipid levels and BMI than healthy controls, with significant differences in total cholesterol and triglyceride levels.10 Kim JH et al.: In two subsets, children with AD had significantly higher levels of total cholesterol and triglycerides, with the SCORAD index also associated with these lipid abnormalities. Additionally, higher total cholesterol was linked to an increased risk of AD onset over five years.8 Seong MK et al. used data from Korean adolescents and found that those with AD had significantly higher levels of total cholesterol and low-density lipoprotein cholesterol compared to those without AD. Dyslipidemia (LDL-Ch (Low-Density Lipoprotein Cholesterol) ≥130 mg/dL) was identified as a risk factor for AD, although high total cholesterol (≥200 mg/dL) was not. No significant relationship between obesity and AD prevalence was found, but dyslipidemia may be associated with AD development11 In contrast, a UK Biobank-based observational study done by Tang Z. et al. included a total of 502,505 participants and found that the association of triglycerides with AD was not significant and the effect on HDL exhibited a high inconsistency12 Standl M. et al. analysed three cohorts (a total of more than 1 million cases) and found that AD was not associated with cardiovascular risk factors and no differences in metabolite levels were detected (P = .9846 for HDL cholesterol, P = .6942 for Tg and for LDL ( P = .3007).13 Leigh JH et al. enrolled 2,914 adolescents (12-18 y.o.) and performed two models for the study. Neither showed a significant association between AD and hypercholesterolemia (P = .343 for Model 1 and 0.287 for Model 2), low HDL (P = .456 and 0.408), or hypertriglyceridemia (P = .087 for Model 1 and P = .106 for Model 2).14 The inconsistency might be explained by differences in study design, diagnostic criteria for AD and dyslipidemia, regional differences, and the varied definitions of overweight and obesity used in the studies. Also, while socioeconomic factors were considered, other confounders (e.g., diet, physical activity, or genetic predispositions) were not controlled for. The major strength of this study is that all data were collected by the same person, and all blood work was performed in the same laboratory. This way, misclassification and differing interpretations of the results were avoided, and we were working with well-defined groups. However, our sample size for either group was small, which limits the statistical power to detect significant differences. Also, relying heavily on P values might overlook clinically significant trends that are not statistically significant (e.g., borderline results for lipid levels).Limitations
This study is limited by its relatively small sample size, which may reduce statistical power and the ability to detect significant differences between groups. Additionally, the cross-sectional design precludes drawing conclusions about causality between atopic dermatitis and alterations in lipid profiles. Finally, the study population was region-specific, potentially limiting the generalizability of findings to broader pediatric populations.
Conclusion
While trends toward dyslipidemia were observed in pediatric AD patients, no definitive association was identified. Future research should focus on larger, multicenter cohorts with robust control of confounders to elucidate the relationship between AD and lipid abnormalities in children.
Declarations
Animal and Human Rights Statement
All procedures performed in this study were in accordance with the ethical standards of the institutional and/or national research committee and with the 1964 Helsinki Declaration and its later amendments or comparable ethical standards.
Informed Consent
Written informed consent was obtained from the parents or legal guardians of all participants.
Data Availability
The data supporting the findings of this study are available from the corresponding author on reasonable request.
Conflict of Interest
The authors declare no conflict of interest.
Funding
None.
Author Contributions (CRediT Taxonomy)
Conceptualization: N.K.
Methodology: N.K., I.K.
Formal Analysis: N.K.
Investigation: N.K., I.K., M.B.B.
Data Curation: N.K.
Writing – Original Draft Preparation: N.K.
Writing – Review & Editing: I.K., M.B.B.
Supervision: M.B.B.
AI Usage Disclosure
The authors declare that no AI-assisted technologies were used.
Abbreviations
AD: Atopic dermatitis
ANOVA: Analysis of variance
BMI: Body mass index
HDL: High-density lipoprotein
LDL: Low-density lipoprotein
SCORAD: SCORing Atopic Dermatitis
References
- Fishbein AB, Silverberg JI, Wilson EJ, Ong PY. Update on atopic dermatitis: Diagnosis, severity assessment, and treatment selection. J Allergy Clin Immunol Pract. 2020;8(1):91-101. doi:10.1016/j.jaip.2019.06.044
- Malik K, Heitmiller KD, Czarnowicki T. An update on the pathophysiology of atopic dermatitis. Dermatol Clin. 2017;35(3):317-26. doi:10.1016/j.det.2017.02.006
- Frazier W, Bhardwaj N. Atopic dermatitis: Diagnosis and treatment. Am Fam Physician. 2020;101(10):590-8.
- Sid Idris F. Treatment of atopic dermatitis in children. Cureus. 2024;16(9):e69416. doi:10.7759/cureus.69416
- Boutari C, Mantzoros CS. A 2022 update on the epidemiology of obesity and a call to action: As its twin, the COVID-19 pandemic appears to be receding, the obesity and dysmetabolism pandemic continues to rage on. Metabolism. 2022;133:155217. doi:10.1016/j.metabol.2022.155217
- Silverberg JI, Greenland P. Eczema and cardiovascular risk factors in 2 US adult population studies. J Allergy Clin Immunol. 2015;135(3):721-8.e6. doi:10.1016/j.jaci.2014.11.023
- Trandafir LM, Dodi G, Frasinariu O, et al. Tackling dyslipidemia in obesity from a nanotechnology perspective. Nutrients. 2022;14(18):3774. doi:10.3390/nu14183774
- Kim JH, Lee SW, Yon DK, et al. Association of serum lipid parameters with the SCORAD index and onset of atopic dermatitis in children. Pediatr Allergy Immunol. 2021;32(2):322-30. doi:10.1111/pai.13391
- Manti S, Leonardi S, Panasiti I, Arrigo T, Salpietro C, Cuppari C. Serum IL-10, IL-17 and IL-23 levels as “bioumoral bridges” between dyslipidemia and atopy. Cytokine. 2017;99:43-9. doi:10.1016/j.cyto.2017.07.002
- Agón-Banzo PJ, Sanmartin R, García-Malinis AJ, et al. Body mass index and serum lipid profile: association with atopic dermatitis in a paediatric population. Australas J Dermatol. 2020;61(1):e60-4.
- Seong MK, Shin M. Low-density lipoprotein cholesterol is associated with atopic dermatitis in Korean adolescents. Int Arch Allergy Immunol. 2023;184(12):1230-6. doi:10.1159/000533401
- Tang Z, Shen M, Xiao Y, Liu H, Chen X. Association between atopic dermatitis, asthma, and serum lipids: A UK Biobank-based observational study and Mendelian randomization analysis. Front Med (Lausanne). 2022;9:810092. doi:10.3389/fmed.2022.810092
- Standl M, Tesch F, Baurecht H, et al. Association of atopic dermatitis with cardiovascular risk factors and diseases. J Invest Dermatol. 2017;137(5):1074- 81. doi:10.1016/j.jid.2016.11.031
- Leigh JH, Park HJ, Chun SM, Min YS, Choi M. Association of atopic dermatitis with dyslipidemia in adolescents: A cross-sectional study. Ann Dermatol. 2021;33(5):483-5. doi:10.5021/ad.2021.33.5.483
Tables
Additional Information
Publisher’s Note
Bayrakol MP remains neutral with regard to jurisdictional and institutional claims.
Rights and Permissions

This work is licensed under a Creative Commons Attribution-NonCommercial 4.0 International License (CC BY-NC 4.0). To view a copy of the license, visit https://creativecommons.org/licenses/by-nc/4.0/
About This Article
How to Cite This Article
Nojus Kausyla, Inga Kisieliene, Matilda Bylaite-Bucinskiene. Exploring the link between atopic dermatitis and lipid profiles in children: a cross-sectional analysis. Ann Clin Anal Med 2026;17(8):814-817. doi:10.4328/ACAM.22580
Publication History
- Received:
- 27.01.2025
- Accepted:
- 10.03.2025
- Published Online:
- 20.11.2025
- Printed:
- 01.08.2026