
Abstract
AimThe present study aimed to evaluate the relationship between muscle thickness and subcutaneous adipose tissue thickness (SATT) in the upper and lower extremities and the presence of osteoporosis/osteopenia in postmenopausal women (PMW).MethodsThree groups were formed based on T-score ranges, each consisting of 30 PMW with similar demographic characteristics: healthy, osteopenic, and osteoporotic. The quadriceps femoris muscle thicknesses (QFMT) and the biceps brachii plus brachialis muscle thicknesses (BB+BMT) of the participants, along with the SATT at these points, were measured by ultrasound (US). Notably, this is the first study to utilize receiver operating characteristic (ROC) analysis to assess QFMT and BB+BMT as predictors of osteopenia and/or osteoporosis in PMW. One of the unique contributions of this study to the literature is that the participants were selected from individuals who had not previously received osteoporosis treatment.ResultsA significant difference in QFMT values was observed among the three groups (all p<0.05). L1-L4 T-score showed a moderate positive correlation with QFMT (r=0.562, p<0.001) and a weak correlation with BB+BMT (r=0.382, p=0.003). Additionally, a weak positive correlation was found between QFMT and the femoral neck T-score (r=0.307, p=0.017). Among the parameters examined for predicting osteoporosis, the largest area under the curve (AUC) was found for QFMT, with a value of 0.899 (p<0.001).ConclusionThe current study demonstrated a significant association between osteoporosis and muscle thickness, in contrast to SATT, with QFMT being more impactful in predicting the disease than BB+BMT.
Keywords
Introduction
Recent research highlights the intricate links between bone, muscle, and adipose tissue, revealing common mechanisms in the aetiopathogenesis of osteoporosis and sarcopenia. Osteoporosis, characterised by reduced bone density and structural deterioration, resulting in an elevated risk of fractures, shares common pathophysiological pathways with sarcopenia, which involves the progressive loss of muscle mass, strength, and function. Evidence suggests that both conditions are influenced by age-related changes in hormonal signalling, inflammatory processes, and oxidative stress, all of which impact bone remodelling and muscle integrity.1 Studies have indicated a high prevalence of sarcopenia in osteoporotic PMW, with rates around 50%.2-3 The assessment of muscle and bone health in PMW is a crucial aspect of geriatric care, requiring reliable and valid evaluation methods. Ogawa et al. have demonstrated the reliability and validity of QFMT measurements using the US. They compared QFMT with muscle mass and strength assessments, suggesting that evaluating muscle thickness could serve as a valid alternative method to comprehensive full-body muscle assessments in clinical practice.4 This method may offer an opportunity to monitor changes in muscle health over time and evaluate the interaction between muscle and bone in PMW.
The primary aim of this study was to evaluate the relationship between muscle thickness and SATT in the upper and lower extremities and bone measurement parameters in PMW. Additionally, this study aimed to determine whether subcutaneous fat tissue or muscle tissue is more significant in predicting osteoporosis and to assess whether the upper or lower extremity has a larger impact. Lastly, the main goal of the present study was to identify US parameters that can predict the severity of bone resorption as an alternative to dual-energy X-ray absorptiometry (DEXA). To our knowledge, this is the first study to present upper and lower extremity muscle thickness data using ROC analysis for predicting osteopenia and/or osteoporosis in PMW.
Materials and Methods
Design of the StudyThis prospective comparative study was conducted from September 2022 to December 2022 at the Physical Medicine and Rehabilitation Clinic of Hatay Training and Research Hospital.Characteristics of the SubjectsPMWs over the age of 50 who had not previously used antiosteoporosis drugs and had a DEXA examination were included in the study. Three groups were formed, each consisting of 30 healthy PMW (T-score > -1), 30 osteopenic PMW (T-score between -1 and -2.5), and 30 osteoporotic PMW (T-score < -2.5) as determined by DEXA measurements, all with similar demographic and physical characteristics.5 Exclusion criteria for the study included the use of steroids, rheumatic disorders, chronic hepatic and renal diseases, haematological conditions, malignant diseases, scoliosis, neurological disorders, severe gonarthrosis, severe intervertebral disc disease, severe spinal stenosis, a history of chronic obstructive pulmonary disease, heart failure, and myocardial infarction and endocrine disorders such as thyroid and parathyroid diseases, as well as moderate to severe diabetes. Patients with a history of major musculoskeletal operations were also not included. Individuals were considered to have exercised if they participated in moderate to high-intensity physical activity or walking (for more than 30 minutes per day) on at least 3 to 4 days per week.6Clinical EvaluationsParticipants’ age, gender, weight, height, body mass index (BMI), menopause period, bone mineral density (BMD) measurements, exercise and smoking status, and comorbidities such as hypertension, mild diabetes mellitus, and hyperlipidaemia were noted. All eligible participants who were willing to participate in the study were first measured by the US, and then their BMD was evaluated via DEXA. When calculating the T-scores of lumbar vertebrae 1 to 4, vertebrae scores that deviated more than one standard deviation from adjacent vertebrae due to collapse or degenerative alterations were excluded. The mean value of the remaining vertebrae was then used for calculation.7
All muscle thicknesses and SATTs were assessed using a Clarius L7 HD3 Portable Handheld US device. The QFMT was measured at half the distance between the anterior superior iliac spine and the upper edge of the patella. QFMT was calculated by measuring the distance between the femoral periosteum and the rectus femoris superficial fascia with the individual positioned supine and the lower limbs extended. SATT was assessed by measuring the distance between the superficial fascia of the rectus femoris muscle and the skin from this reference point.4,8 (Figure 1A). During the examination of the upper extremity, participants were placed supine with their arm relaxed and their forearm positioned in extension at the elbow. The BB+BMT was evaluated by measuring a point located on an imaginary line between the acromion and the antecubital fold, positioned two-thirds distally along this line. BB+BMT was evaluated by measuring the distance between the humeral periosteum and the superficial fascia of the biceps brachii. Subsequently, at this reference point, the SATT was evaluated by measuring the distance between the superficial muscle fascia of the biceps brachii and the skin.9 (Figure 1B). All US measurements were repeated three times by a physiatrist experienced in musculoskeletal US, and average values were recorded. A sufficient amount of gel was applied, and unnecessary pressure on the tissue was avoided to prevent compression of the measured soft tissues.Ethical ApprovalThis study was approved by the Ethics Committee of Hatay Mustafa Kemal University, Tayfur Ata Sökmen Faculty of Medicine Clinical Research Ethics Committee (Date: 22.08.2022, Decision No: 06). An informed consent form was obtained from all participants.Statistical AnalysisThe data obtained from the study were analysed using version 22.0 of the Statistical Package for Social Sciences (SPSS). The normal distribution of continuous variables was checked using the Kolmogorov-Smirnov test and histogram analysis. Descriptive analysis for continuous data is presented as mean, standard deviation (SD), median, and range (minimum-maximum), while categorical data are expressed as counts (n) and percentages (%). For comparing continuous variables with a normal distribution across three groups, the One-Way ANOVA test was employed, accompanied by Bonferroni-adjusted pairwise comparisons. For continuous variables that did not conform to a normal distribution, the Kruskal-Wallis H test was performed, along with Bonferroni-adjusted pairwise comparisons. Categorical data were analyzed using Fisher’s Exact test or Pearson’s Chi-Square test, as appropriate. Spearman’s correlation analysis was applied to variables that did not exhibit a normal distribution. The strength of the correlation (r) was interpreted as follows: insignificant correlation (0.00-0.30), low correlation (0.30-0.50), moderate correlation (0.50-0.70), high correlation (0.70-0.90), and very high correlation (0.90-1.00).10 ROC analysis was utilised to determine the predictive value of parameters, including sensitivity, specificity, and the area under the curve. For all analyses, a p-value below 0.05 was regarded as indicative of statistical significance.Reporting GuidelinesThis study was reported in accordance with the STROBE guideline.
Results
The demographic characteristics and comorbidities of the groups are presented in Table 1. The analysis of these characteristics showed that there were no statistically significant differences between the groups (all p>0.05). The comparison of DEXA and US measurements of the groups was presented in Table 2. The T-score values for the L1-L4 vertebrae, total hip, and femoral neck were statistically different between the groups (p<0.05), except for the total hip T-score between the healthy group and osteopenic group. There was a significant difference in QFMT values among the three groups (all p<0.05). Additionally, a significant difference between the groups in terms of thigh SATT was detected (p=0.017), and according to the post hoc analysis, the only significant difference was found between the healthy group and osteopenic group (p=0.021). A significant difference was also found between the groups in terms of BB+BMT values (p=0.001), and according to the post hoc analysis, the only significant difference was found between the healthy group and osteoporotic group (p=0.001). However, no significant difference in arm SATT values among the three groups was detected (p=0.147). The correlation of muscle thicknesses and T-scores was presented in Table 3. L1-L4 T-score showed a moderate positive correlation with QFMT (r=0.562, p<0.001) and a weak correlation with BB+BMT (r=0.382, p=0.003). A weak positive correlation was observed between the QFMT and the femoral neck T-score (r=0.307, p=0.017). Furthermore, a statistically significant positive moderate relationship was found between QFMT and BB+BMT (r=0.582, p<0.001). The ROC curve analysis of QFMT and BB+BMT was presented in Figure 2. The largest AUC was found for QFMT, with a cutoff value of 34.95, showing 83.3% sensitivity and 83.3% specificity, an AUC of 0.899 (p<0.001), and a confidence interval of 0.816 to 0.983, indicating that a QFMT value of 34.95 or lower is clinically significant for identifying osteoporosis.
Discussion
In the osteoporotic group, mean QFMT and BB+BMT values were reduced compared to the healthy group, while thigh SATT and arm SATT values were similar between the osteoporotic group and the healthy group. A moderate positive correlation was found between QFMT and the L1-L4 T-score, while a weak positive correlation was observed between QFMT and the femoral neck T-score. Additionally, a weak positive correlation was identified between the L1-L4 T-score and BB+BMT. In the ROC analysis performed to determine the osteoporosis predictive value of QFMT, the AUC was determined to be 0.899, which is a very good value. QFMT appears to have a stronger association with bone health compared to BB+BMT. No clinically significant relationship was detected between extremity SATT values and bone health.
Crivelli et al. found that visceral and subcutaneous adipose tissue had harmful effects on bone health in PMW.11 The findings of the Framingham Osteoporosis Study suggested that visceral adipose tissue may not have a significant impact on the skeleton independent of weight.12 Kim et al. found that subcutaneous adipose tissue has a protective effect on bone against osteoporosis, while visceral adipose tissue has harmful effects on bone health in PMW. Subcutaneous adipose tissue is the primary source of endogenous estrogen that enhances BMD in PMW. On the other hand, visceral adipose tissue is associated with insulin resistance and inflammation, which may have negative effects on bone health.13 Despite this theoretical information, the relationship between adipose tissue and osteoporosis is contradictory in the literature. In the present study, no clinically significant relationship was detected between extremity SATT values and osteoporosis.
Bone and muscle are interconnected organs that functionally and developmentally form a cohesive unit, engaging in bidirectional interactions at various levels, from molecular to organic. Muscle contractions play pivotal roles in determining bone mass and shape. Additionally, physical activity has an anabolic effect on both bone and muscle metabolism. In addition to mechanical load, muscle and bone interact through biochemical signaling pathways such as myokines (myostatin, irisin, insulin-like growth factor-1 (IGF-1), interleukin (IL)-6, IL-7, IL-15 and fibroblast growth factor-2) and bone-derived factors (fibroblast growth factor-23, prostaglandin E2, osteocalcin, transforming growth factor β and sclerostin). Further factors such as aging, circadian cycles, neural networks, nutritional consumption, and exosomes also impact the interaction between bone and muscle.14
Recent studies have provided strong evidence of an association between muscle thickness and osteoporosis.15-16 Liu et al. indicated that muscle plays a more significant role than fat in bone homeostasis, emphasizing the importance of muscle health in maintaining bone density and strength, and recommended improving muscle health for the prevention of osteoporosis in elderly individuals.17 Tiftik et al. investigated the relationship between sarcopenia and osteoporosis in PMW. They found that grip strength and anterior thigh muscle thickness were correlated with lumbar vertebral BMD, and chair stand test performance was linked to femoral neck BMD.16 Karatekin et al. evaluated mid-upper arm muscle thickness and triceps SATT via US in men with osteoporosis. They determined that mid-upper arm muscle thickness is correlated with the degree of osteoporosis severity and found no relationship between osteoporosis severity and SATT measured via US or skinfold calliper.15 In the current study, while a relationship between extremity muscle thickness and bone health was found consistent with the literature, no relationship was detected between extremity SATT and bone health. Not only did Ogawa et al. demonstrate that QFMT may be a valid diagnostic tool for assessing overall muscular health, but this finding was also supported by the research of Wilson et al., Hogenbirk et al., and Yoshida et al.4,18-19-20 The current study showed that as bone health deteriorates, anterior thigh muscle thickness, which may serve as an indicator of overall body muscle health, also decreases.
A study in mice found that pharmacological inhibition of chemotherapy-induced bone loss also reduced loss of muscle mass and function and supported the hypothesis that bone-derived factors influence muscle.21 Six months of combined alendronate and calcitriol therapy has been shown to improve both lumbar bone BMD and handgrip strength, a key indicator of sarcopenia in PMW.22 Harada et al. showed that alendronate may have a positive effect on both bone and muscle in individuals with osteoporosis.23 Huang et al. revealed that zoledronic acid provides benefits not only to bone health but also to muscle tissue.24 Denosumab treatment was associated with increased muscle strength in both upper and lower extremities in individuals with low BMD and weak muscle strength.25
The existing literature suggests a positive relationship between osteoporosis treatment and muscle tissue health. However, previous studies investigating the correlation between muscle tissue health and bone tissue health did not specify whether the patients had received prior osteoporosis treatment.15-16-17 In contrast, the current study stands out as it focuses on newly diagnosed patients who had not received osteoporosis treatment previously. The current study is critically important as it eliminates the direct effect of osteoporosis treatment on muscle tissue, allowing for a more precise assessment of the relationship between the two tissues. A better understanding of the interaction between muscle and bone tissues could contribute to the development of therapeutic approaches targeting both tissues, although further research is necessary. This mutual relationship could guide future research on diagnostic and follow-up parameters.
Limitations
Despite these strengths, the study has several limitations. First, the cross-sectional design of the study limits the ability to establish causal relationships between muscle thickness and bone health. Longitudinal studies are needed to determine the direction and causality of this relationship. Second, the relatively limited sample size restricts the generalizability of the findings to a broader population. Larger and more diverse cohorts are required to confirm the reproducibility and robustness of the results. The third limitation is the lack of evaluation of participants’ dietary intake of protein, calcium, and vitamin D, as well as their sun exposure duration. The fourth limitation pertains to the absence of muscle strength and functionality evaluations. Finally, important parameters such as muscle echo intensity, cross-sectional area, and pennation angle were not analyzed.
Conclusion
The current study demonstrated a significant relationship between osteoporosis and muscle thickness, in contrast to SATT, with QFMT showing a higher predictive value for the disease than BB+BMT. While QFMT demonstrated potential as a predictive parameter for osteoporosis in PMW, further validation is required through larger and more diverse studies.
Abbreviations
AUC: Area under the curve
BB+BMT: Biceps brachii plus brachialis muscle thickness
BMD: Bone mineral density
BMI: Body mass index
DEXA: Dual-energy X-ray absorptiometry
IL: Interleukin
PMW: Postmenopausal women
QFMT: Quadriceps femoris muscle thickness
ROC: Receiver operating characteristic
SATT: Subcutaneous adipose tissue thickness
SD: Standard deviation
SPSS: Statistical Package for the Social Sciences
US: Ultrasound
References
- He C, He W, Hou J, et al. Bone and muscle crosstalk in aging. Front Cell Dev Biol. 2020;8:585644. doi:10.3389/fcell.2020.585644
- Huo YR, Suriyaarachchi P, Gomez F, et al. Phenotype of osteosarcopenia in older individuals with a history of falling. J Am Med Dir Assoc. 2015;16(4):290-295. doi:10.1016/j.jamda.2014.10.018
- Cevei M, Onofrei RR, Cioara F, Stoicanescu D. Correlations between the quality of life domains and clinical variables in sarcopenic osteoporotic postmenopausal women. J Clin Med. 2020;9(2):441. doi:10.3390/jcm9020441
- Ogawa M, Matsumoto T, Harada R, et al. Reliability and validity of quadriceps muscle thickness measurements in ultrasonography: a comparison with muscle mass and strength. Prog Rehabil Med. 2023;8:20230008. doi:10.2490/prm.20230008
- Kanis JA, Melton LJ III, Christiansen C, Johnston CC, Khaltaev N. The diagnosis of osteoporosis. J Bone Miner Res. 1994;9(8):1137-1141.
- Nakagawa T, Koan I, Chen C, et al. Regular moderate- to vigorous-intensity physical activity rather than walking is associated with enhanced cognitive functions and mental health in young adults. Int J Environ Res Public Health. 2020;17(2):614. doi:10.3390/ijerph17020614
- Hansen KE, Vallarta-Ast N, Krueger D, Gangnon R, Drezner MK, Binkley N. Use of the lowest vertebral body T-score to diagnose lumbar osteoporosis in men: is “cherry picking” appropriate? J Clin Densitom. 2004;7(4):376-381. doi:10.1385/jcd:7:4:376
- Battaglia Y, Ullo I, Massarenti S, et al. Ultrasonography of quadriceps femoris muscle and subcutaneous fat tissue and body composition by BIVA in chronic dialysis patients. Nutrients. 2020;12(5):1388. doi:10.3390/nu12051388
- Jenkins ND, Miller JM, Buckner SL, et al. Test-retest reliability of single transverse versus panoramic ultrasound imaging for muscle size and echo intensity of the biceps brachii. Ultrasound Med Biol. 2015;41(6):1584-1591. doi:10.1016/j.ultrasmedbio.2015.01.017
- Mukaka MM. A guide to appropriate use of correlation coefficient in medical research. Malawi Med J. 2012;24(3):69-71.
- Crivelli M, Chain A, da Silva IT, Waked AM, Bezerra FF. Association of visceral and subcutaneous fat mass with bone density and vertebral fractures in women with severe obesity. J Clin Densitom. 2021;24(3):397-405. doi:10.1016/j.jocd.2020.10.005
- Liu CT, Broe KE, Zhou Y, et al. Visceral adipose tissue is associated with bone microarchitecture in the Framingham Osteoporosis Study. J Bone Miner Res. 2017;32(1):143-150. doi:10.1002/jbmr.2931
- Kim J, Choi H, Ku E, et al. Regional body fat depots differently affect bone microarchitecture in postmenopausal Korean women. Osteoporos Int. 2016;27(3):1161-1168. doi:10.1007/s00198-015-3329-1
- Li G, Zhang L, Wang D, et al. Muscle-bone crosstalk and potential therapies for sarco-osteoporosis. J Cell Biochem. 2019;120(9):14262-14273. doi:10.1002/jcb.28946
- Karatekin BD, Mesci E, İçağasioğlu A. The relationship between anthropometric and ultrasonographic muscle and subcutaneous fat thickness measurements and osteoporosis in male patients. Turk J Osteoporos. 2023;29(3):150-155.
- Tiftik T, Kara M, Koyuncu EG, et al. The relationship between sarcopenia-related measurements and osteoporosis: the SARCOP study. Osteoporos Int. 2023;34(1):53-58. doi:10.1007/s00198-022-06563-z
- Liu C, Wong PY, Tong X, et al. Muscle plays a more superior role than fat in bone homeostasis: a cross-sectional study of old Asian people. Front Endocrinol (Lausanne). 2023;13:990442. doi:10.3389/fendo.2022.990442
- Wilson DV, Moorey H, Stringer H, et al. Bilateral anterior thigh thickness: a new diagnostic tool for the identification of low muscle mass? J Am Med Dir Assoc. 2019;20(10):1247-1253.e2. doi:10.1016/j.jamda.2019.04.005
- Hogenbirk RN, Viddeleer AR, Hentzen JE, et al. Thickness of biceps and quadriceps femoris muscle measured using point-of-care ultrasound as a representation of total skeletal muscle mass. J Clin Med. 2022;11(22):6606. doi:10.3390/jcm11226606
- Yoshida T, Watanabe Y, Yokoyama K, Kimura M, Yamada Y. Thigh muscle thickness on ultrasonography for diagnosing sarcopenia: the Kyoto-Kameoka study. Geriatr Gerontol Int. 2024;24(2):156-161. doi:10.1111/ggi.14714
- Essex AL, Pin F, Huot JR, Bonewald LF, Plotkin LI, Bonetto A. Bisphosphonate treatment ameliorates chemotherapy-induced bone and muscle abnormalities in young mice. Front Endocrinol (Lausanne). 2019;10:493522. doi:10.3389/fendo.2019.00809
- Park JH, Park KH, Cho S, et al. Concomitant increase in muscle strength and bone mineral density with decreasing IL-6 levels after combination therapy with alendronate and calcitriol in postmenopausal women. Menopause. 2013;20(7):747-753. doi:10.1097/gme.0b013e31827cabca
- Harada A, Ito S, Matsui Y, et al. Effect of alendronate on muscle mass: investigation in patients with osteoporosis. Osteoporos Sarcopenia. 2015;1(1):53-58. doi:10.1016/j.afos.2015.07.005
- Huang CF, Shiao MS, Mao TY. Retrospective study of the effects of zoledronic acid on muscle mass in osteoporosis patients. Drug Des Devel Ther. 2021;15:3711-3715. doi:10.2147/dddt.s328858
- Rupp T, von Vopelius E, Strahl A, et al. Beneficial effects of denosumab on muscle performance in patients with low BMD: a retrospective, propensity score-matched study. Osteoporos Int. 2022;33(10):2177-2184. doi:10.1007/s00198-022-06470-3
Tables
Table 1. Comparison of demographic characteristics and comorbidities of the groups
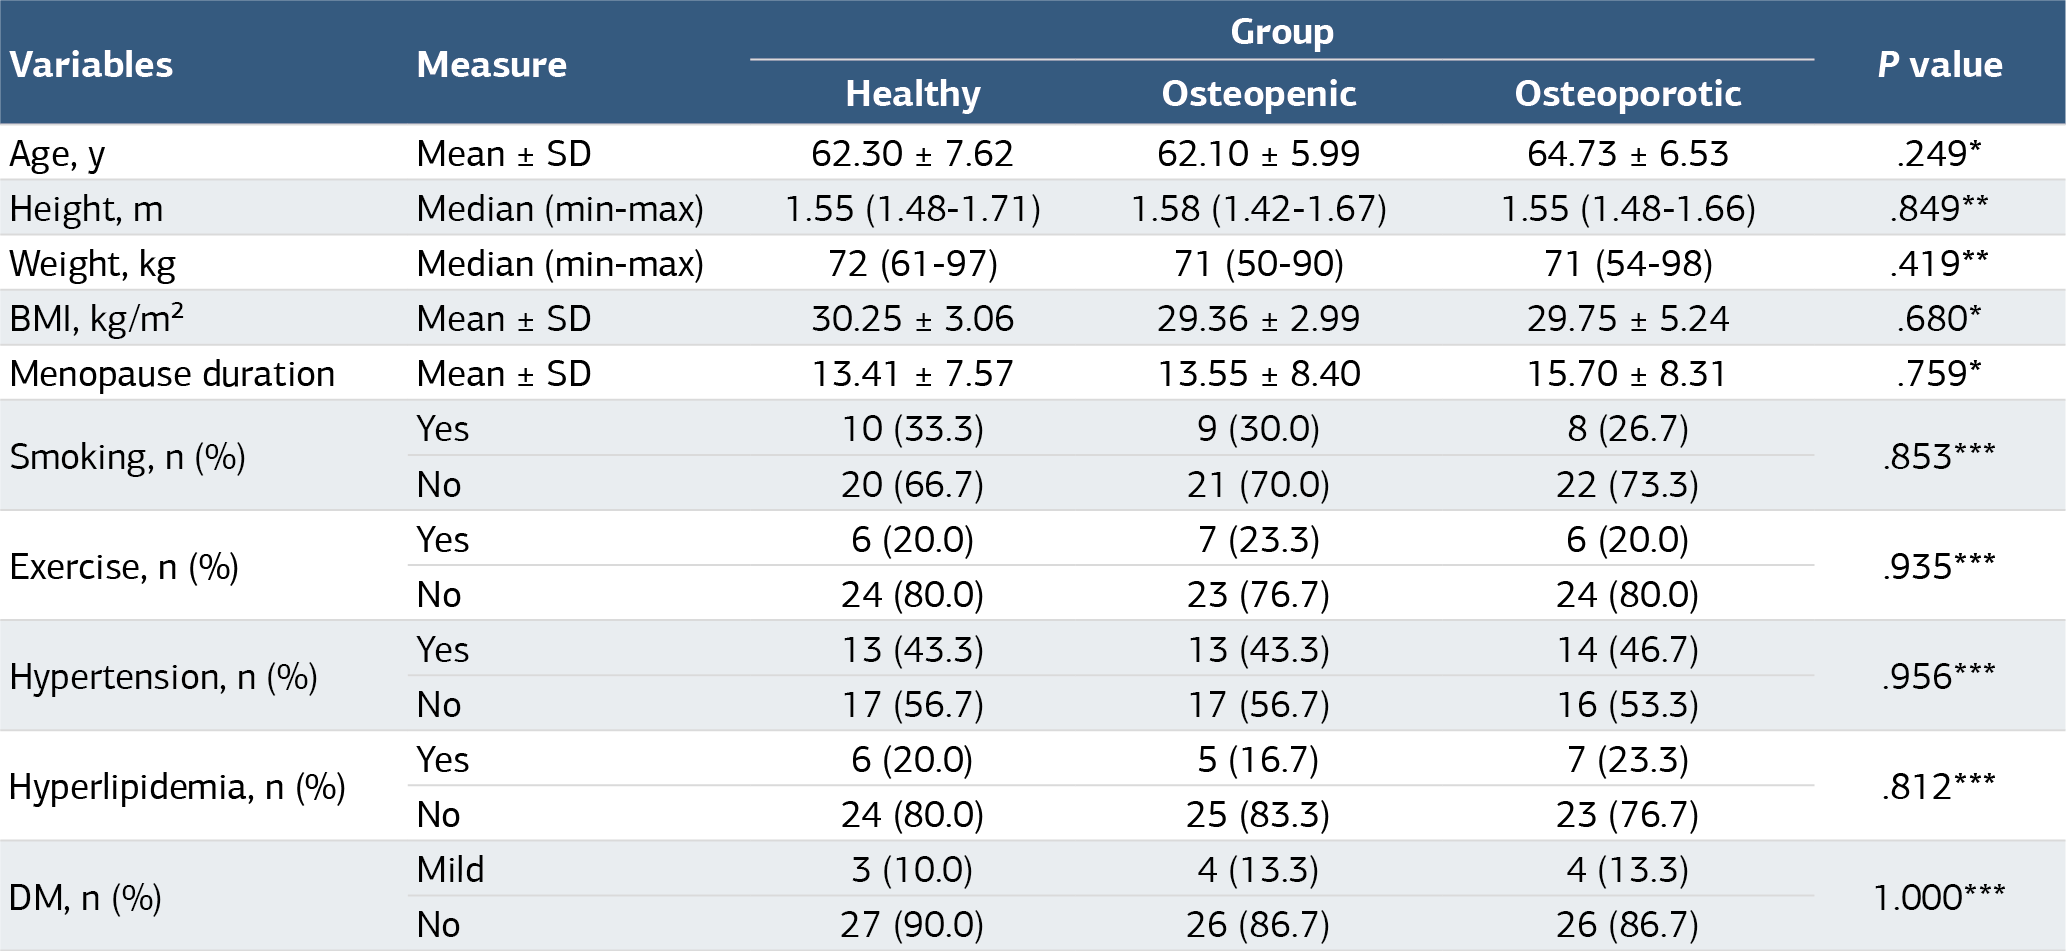
SD: Standard Deviation, BMI: body mass index, DM: diabetes mellitus, *One-Way Anova Test, Kruskal Wallis H Test,*Pearson Chi Square Test or Fisher’s Exact Test
Table 2. Comparison of DEXA and USG measurements of the groups
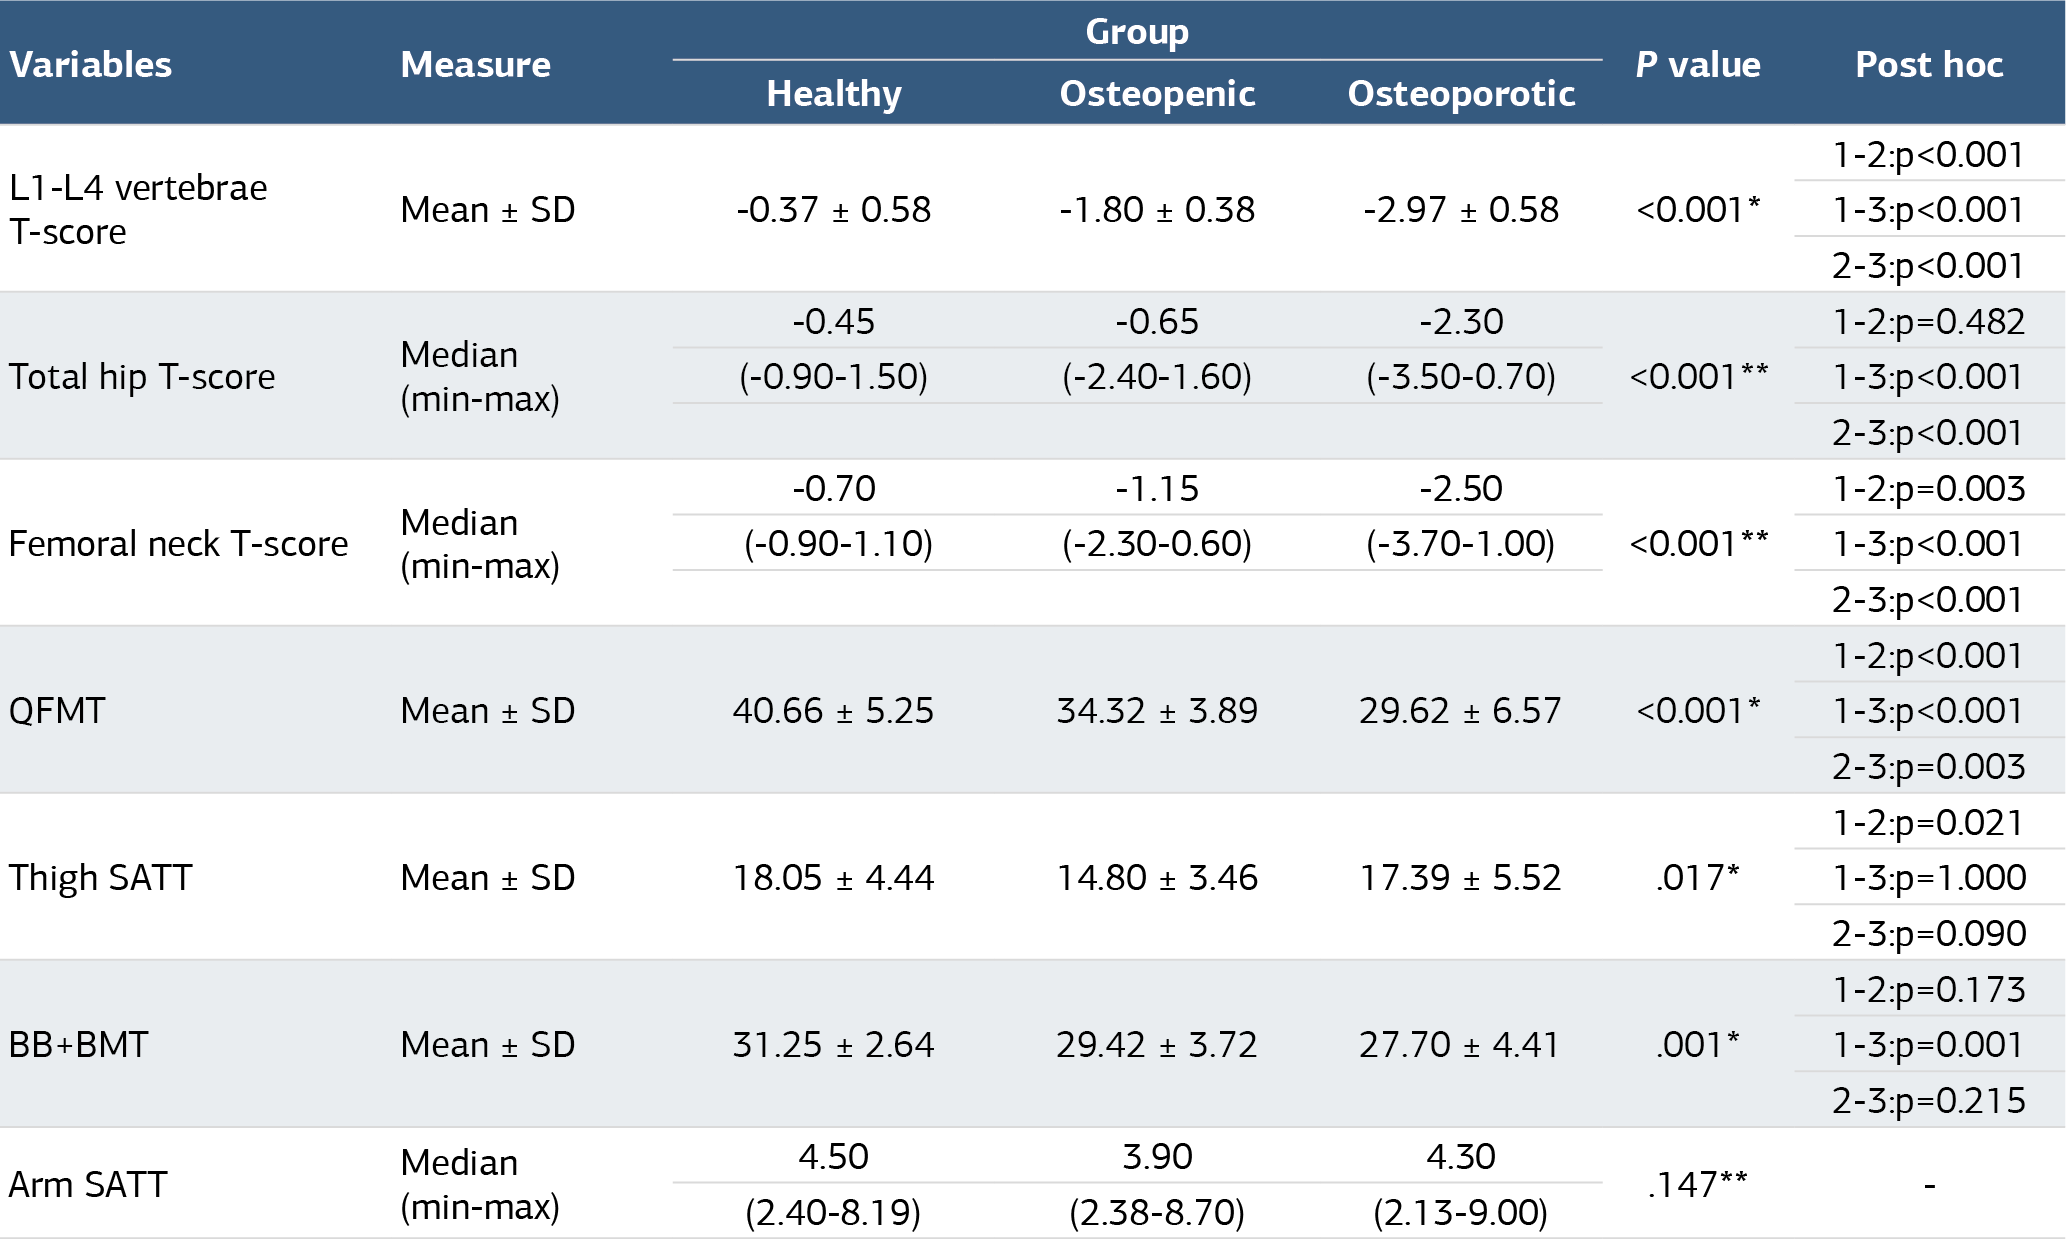
SD: Standard Deviation, QFMT: quadriceps femoris muscle thickness, SATT: subcutaneous adipose tissue thickness, BB+BMT: biceps brachii plus brachialis muscle thickness, *One–Way ANOVA Test (Post Hoc: Bonferroni Test), **Kruskal Wallis H Test (Post Hoc: Bonferroni Test)
Table 3. Correlation of muscle thicknesses and T-scores
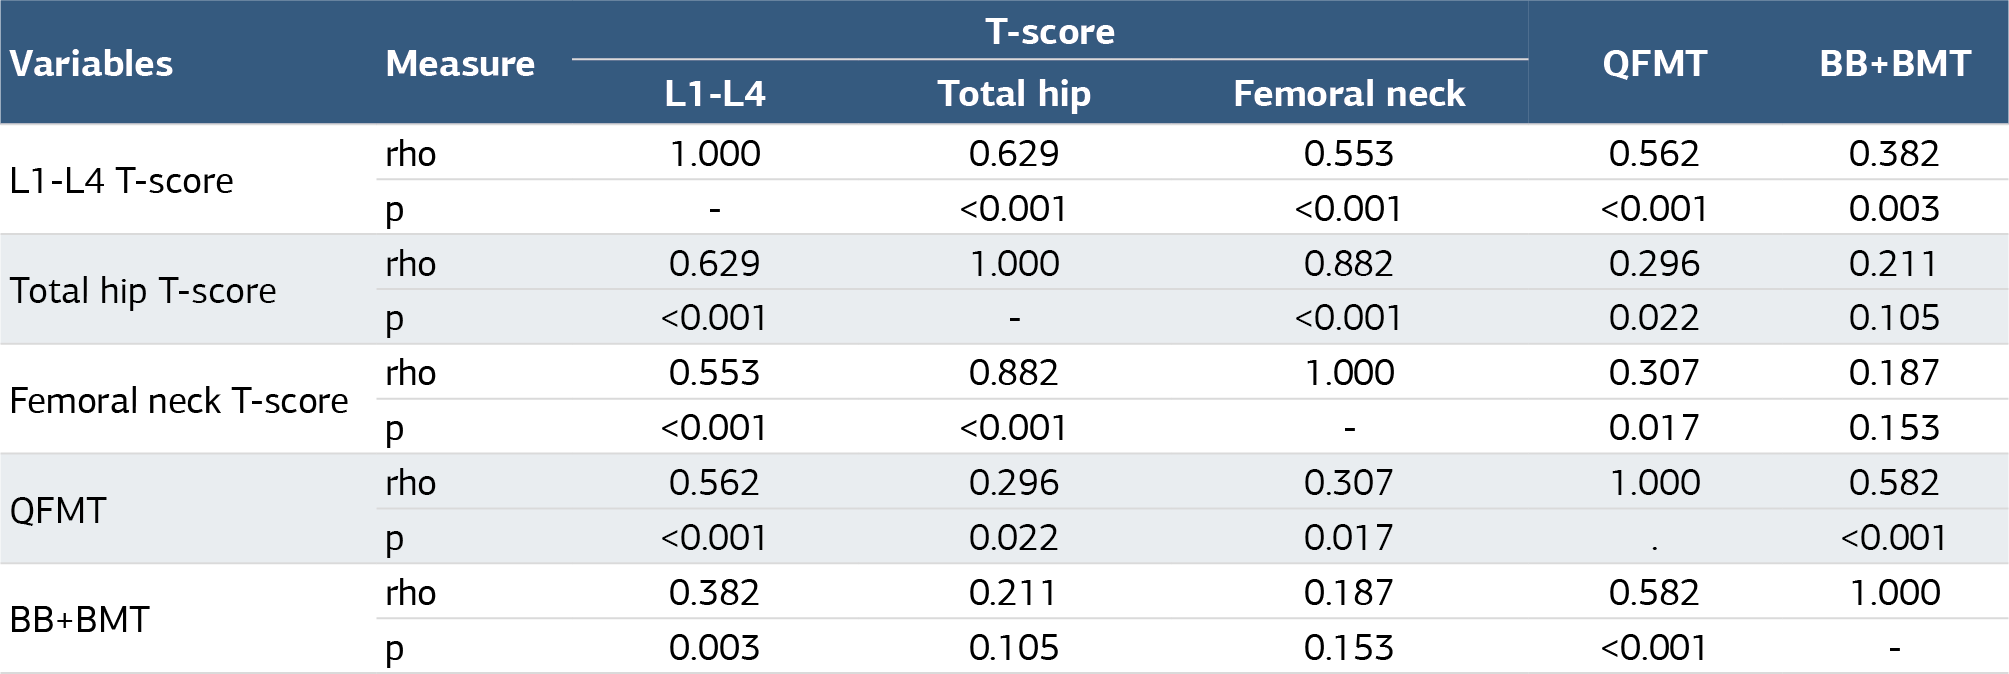
rho: Spearman-Brown rank-difference correlation coefficient
Figures
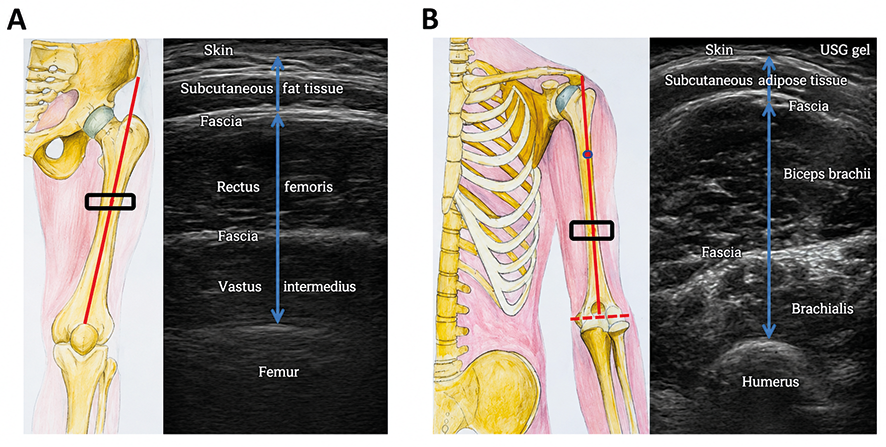
Figure 1. USG images taken from the point corresponding to the reference point on the representative pictures drawn by the author (A.U.) with charcoal and watercolor are presented: anterior thigh muscle and subcutaneous fat thickness measurements (A) and arm muscle and subcutaneous fat thickness measurements (B)
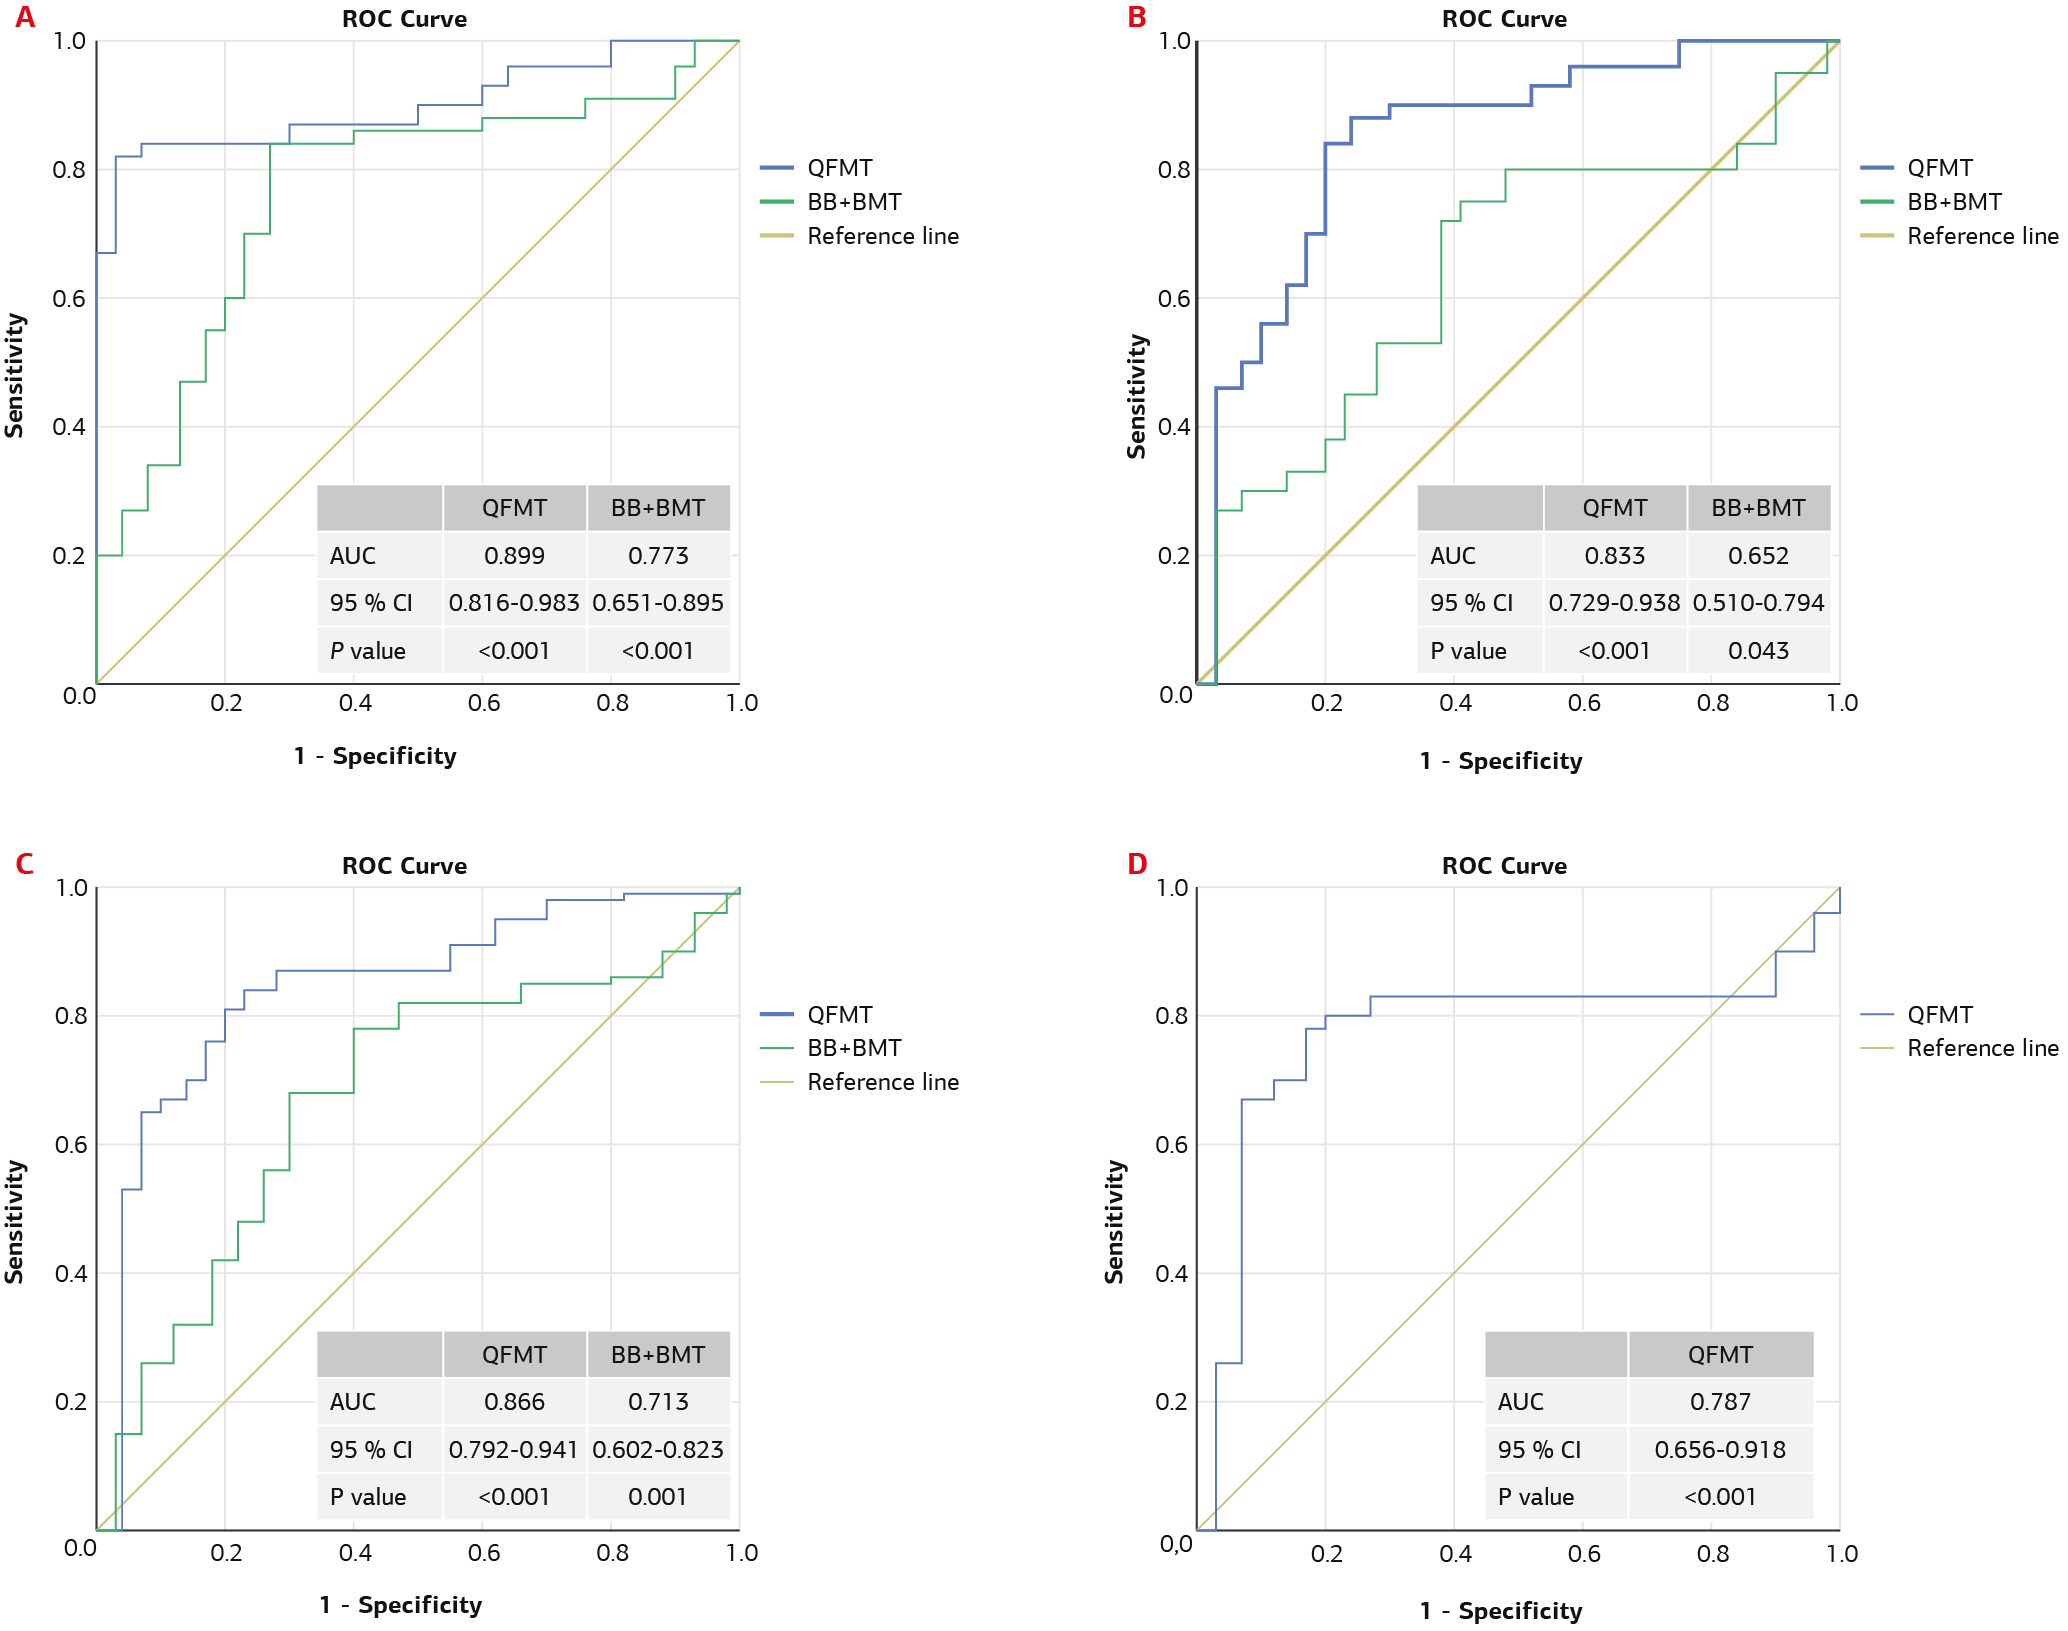
Figure 2. Receiver operator characteristic (ROC) curve analysis of quadriceps femoris muscle thickness (QFMT) and biceps brachii plus brachialis muscle thicknesses (BB+BMT) for the prediction of osteoporosis (A), osteopenia (B), and low bone density conditions (osteoporosis plus osteopenia) (C), as well as ROC curve analysis of QFMT for differentiating osteoporosis from osteopenia (D)
Additional Information
Publisher’s Note
Bayrakol MP remains neutral with regard to jurisdictional and institutional claims.
Rights and Permissions

This work is licensed under a Creative Commons Attribution-NonCommercial 4.0 International License (CC BY-NC 4.0). To view a copy of the license, visit https://creativecommons.org/licenses/by-nc/4.0/
About This Article
How to Cite This Article
Alper Uysal, Hacer Paksoy Karateke. The relationship between osteoporosis and extremity muscle and subcutaneous adipose tissue thickness in postmenopausal women. doi:10.4328/ACAM.22588
Publication History
- Received:
- 29.01.2025
- Accepted:
- 03.03.2025
- Published Online:
- 17.03.2025
- Printed:
- 25.03.2025