
Abstract
AimThe aim of this study was to investigate the bone structure of patients with ectodermal dysplasia (ED) using radiomorphometric indexes and fractal analysis (FA) on dental panoramic radiographs (DPR) and to perform comparisons with a healthy control group.MethodsThe DPRs of a total of 38 patients, including 19 patients with ED and 19 healthy controls, were used in this study. Fractal dimension (FD), panoramic mandibular index (PMI), mental index (MI), and mandibular cortical index (MCI) were measured on the DPRs.ResultsThere was no significant relationship between gender and MI, PMI, and FD values. The distribution of FD, MI, and PMI measurements according to ED showed that MI and PMI values showed statistically significant differences (MI:p=0.023, PMI:p=0.003). While ROI1-r and ROI1-l FD values showed a significant difference between the group with ED and the control group (p=0.001, p=0.002 respectively), FD measurements in ROI2-r/l and ROI3-r/l regions did not show a statistically significant difference between the groups. There was a statistically significant difference between the group with ED and the control group in terms of MCI (p=0.029). There was no significant difference between MCI and other parameters (p>0.05).ConclusionDifferences in FD and radiomorphometric indexes observed between patients with ED and healthy controls indicate the impact of ED on mandibular bone structure.
Keywords
Introduction
Ectodermal dysplasia (ED) refers to a group of diseases that include congenital defects of tissues such as sweat glands, hair, nails, and teeth originating from the ectoderm.1 In general, it is characterized by hypotrichosis, hypohidrosis, anodontia, and hypodontia. Findings such as anodontia, hypodontia, conical teeth, loss of vertical dimension in the upper and lower jaws, sagittal growth retardation in the jaws, alveolar ridge deficiency, and cleft lip and palate may also be observed in individuals with ED.2
Removable partial dentures, total dentures, and overdenture prostheses are the most preferred treatment methods in the treatment of tooth deficiency in ED patients because they can be applied easily and cheaply. A high success rate is also seen in implant surgery in ED cases.3 In the treatment planning of dental implants, it is very important to determine whether the existing jawbone is sufficient to place the implants. In these treatment interventions, two- or three-dimensional imaging methods can be used to determine the amount and quality of bone.1,3
Dental panoramic radiographs (DPRs), which have limitations such as distortion, magnification, and superposition due to their two-dimensionality, are a routinely used imaging method in dentistry due to their advantages such as cost-effectiveness and low-dose radiation. In addition to demonstrating changes in teeth, DPRs can also be used to evaluate structural changes in trabecular bone.4
Radiomorphometric indexes such as mental index (MI), panoramic mandibular index (PMI), and mandibular cortical index (MCI) applied to DPRs are useful methods for estimating bone mineral density (BMD). MCI is related to the BMD of the mandible and refers to the appearance of the mandibular subcortex. MI or mandibular cortical width (MCW) refers to the width between the upper border of the mandibular cortical layer and the lower border of the mandible. PMI is the ratio of the measurements obtained by dividing the height of the lower mandibular cortex by the vertical measurement between the lower border of the mandible and the lower and upper border of the mental foramen.5 Additionally, fractal dimension (FD) analysis of trabecular bone in DPRs can be utilized to evaluate mandibular bone structure.6
FD analysis, which is a mathematical method used for the measurement of complex structures such as trabecular bone, has been used for a long time to evaluate changes in bone structures in various systemic diseases. Fractal analysis (FA) is frequently applied in dentistry to quantitatively describe the quality of bone tissue and to examine early changes in alveolar bone and mandibular trabecular architecture.6-7
In individuals diagnosed with ED; while improving function, phonation, and aesthetics, the dental treatments offered should support normal growth and development. Quantitative evaluation of bone structure in prosthetic treatment and implant planning in individuals with ED is very important for choosing the right treatment.
The purpose of this study is to evaluate the bone structure using some radiomorphometric indexes and FD analysis on DPRs in patients with ED and to guide the clinicians.
Materials and Methods
This retrospective analysis was performed on DPR archive images of ectodermal dysplasia cases admitted to Harran University, Faculty of Dentistry. A total of 38 people, including 19 individuals diagnosed with ectodermal dysplasia and 19 healthy individuals, were included in the study. The control group was selected from the DPR images of healthy individuals who did not have any disease affecting bone metabolism and did not have any missing teeth, lesions, cysts, or tumors that could cause bone destruction in the lower jaw.
All DPRs in the study were obtained using the same digital panoramic X-ray device with 70 kVp, 5 mA, and 15 s exposure time parameters, and radiographs without diagnostic capability due to imprecise patient positioning or exposure errors were excluded from the study. The measured parameters (MCI, MI and PMI) were evaluated separately for each half jaw.
Panoramic morphometric indexes
MCI (Klemetti index): The classification of cortical depiction along the lower mandibular border beyond the bilateral mental foramina is organized into three distinct groups. The category of MCI for each patient was described as the worst of the categories on each side (Figure 1):
• C1: The endosteal border of the mandibular cortex appears to have a sharp and smooth contour.
• C2: The endosteal ridge of the mandibular cortex displays lamellar resorption with persistent endosteal fragments, widely characterized as crescentic disease.
• C3: The endosteal border of the mandibular cortex demonstrates marked porosity with the presence of substantial endosteal debris.6
MI or MCW: It was obtained by measuring the mandibular cortical thickness on a line passing through the center of the mental foramen and perpendicular to the base of the mandible. The mean value was taken by measuring on both sides (Figure 2)(a).6-7
PMI: The ratio of the MI to the distance between the inferior border of the mental foramen and the inferior border of the mandibular cortex was measured as the panoramic mandibular index (Figure 2)(a/b).7Fractal AnalysisSix regions of interest (ROI) were chosen from DPRs. ROI1-r was defined as a 40×40-pixel square at the geometric center of the area between the right mandibular notch and the mandibular foramen. ROI2-r was determined as the geometric center of the right mandibular angle, a square of 60×60 pixels. ROI3-r was designated as a 40×40 pixel square anterior to the right mental foramen, at the same level and in the region without any tooth root or lamina dura (Fig.2). ROI1-l, ROI2-l, and ROI3-l were also selected from the left mandibular side.
Following ROI selection, the image was replicated (Figure 3 a). A Gaussian filter was subsequently imposed on the image to produce a blurred effect (Figure 3b). The resultant blurred image was thereafter extracted from the original image (Figure 3c). In order to improve particular properties of various brightness, such as trabeculae and bone marrow, an image was composed by adding 128 gray values at each pixel position (Figure 3d). Thresholding the image at 128 brightness values also resulted in binarization (Figure 3e). To decrease noise, the binary image was processed by erosion and expansion (Figure 3f,3g). The image was then reversed, making the regions representative of trabeculae black and the bone marrow white (Figure 3h). Eventually, the image was processed through a skeletonization process that incrementally erodes the pixels until only a central pixel line remains (Figure 3i). The software utilizes a box-counting algorithm that divides the image into squares of 2,3,4,4,6,8,12,16,32, and 64 pixels (Figure 3). Several squares containing trabeculae and the total number of frames were calculated for each pixel size. The obtained values were then plotted on a logarithmic scale graph. The slope of the line drawn through the plotted points on the graph yielded the FD value.
All measurements were completed by two dentomaxillofacial radiologists, one with 6 years of experience (EMA) and one with 8 years of experience (SK). The mean FD values of ROI1, ROI2, and ROI3 were determined. It was reviewed by the same observers two weeks after the initial evaluation to assess intra- and inter-observer agreement.Ethical ApprovalThis study was approved by the Ethics Committee of Harran University (Date: 02.12.2024, Decision No: 24.19.11).Statistical AnalysisThe kappa statistics was applied to calculate the inter-observer and intra-observer agreement. Statistical analyzes were calculated using the SPSS 23.0 (SPSS, Chicago, IL, USA) package program. Normality of the data was confirmed by the Shapiro-Wilk test. Independent Samples T test was used to compare all parameters between groups. Relationships between categorical variables were calculated with the Pearson Chi-square test. G power 3.1.9.2 software was used to determine the sample size.Reporting GuidelinesThis study was reported in accordance with the STROBE guideline.
Results
All the evaluations were excellent for the intra- and interobserver correlations (0.88). The mean age of the study group and control group was 12.39±5.5 years and 9.16±3.3 years. No significant difference was found in the age of the two groups (p>0.05). When the relationship between gender and radiomorphometric indexes and FD was examined; there was no significant relationship between MI, PMI, and FD values. While ROI2-l demonstrated a significant difference between genders with the measured FD value (p=0.032); ROI1-r/l, ROI2-r, and ROI3-r/l FD values did not show a statistically significant difference according to gender (p>0.05) (Table 1).
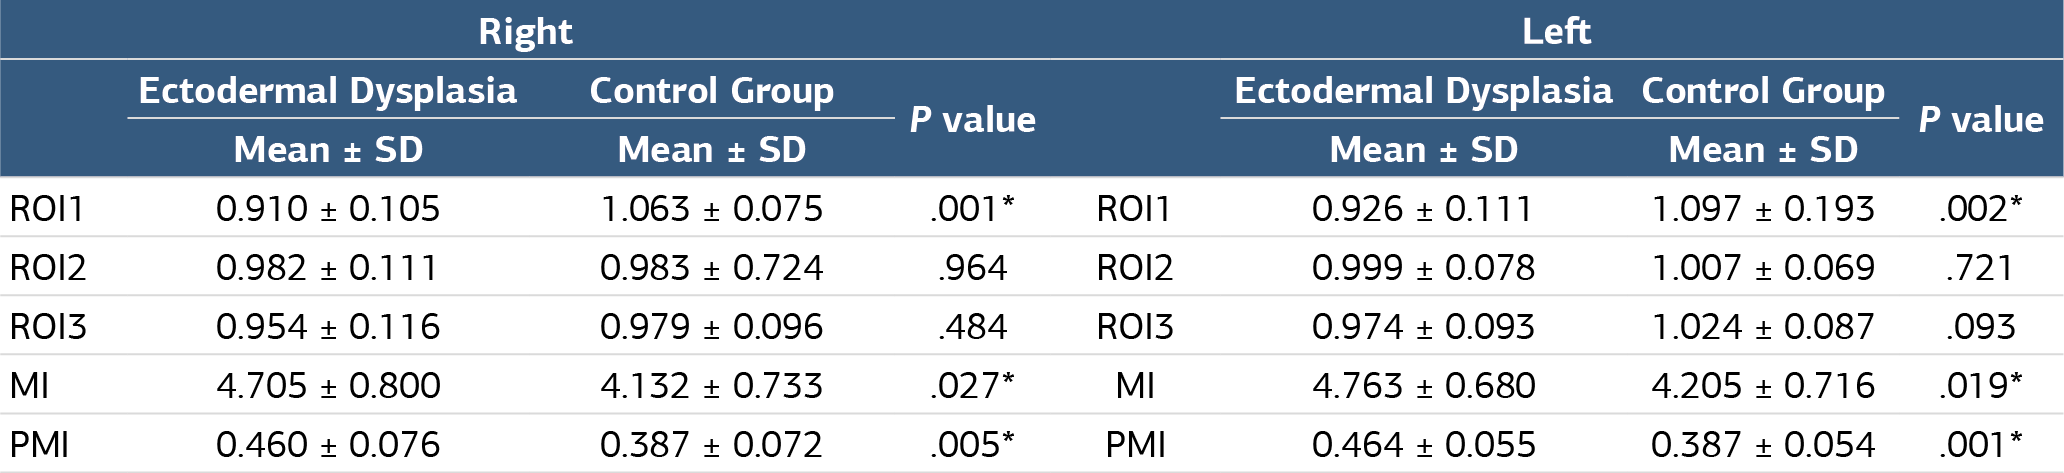
Regarding the distribution of FD, MI, and PMI measurements according to the patient group; MI and PMI were detected to have a statistically significant difference on both the right and left sides (right MI:p=0.027, left MI:p=0.019, right PMI:p=0.005, left PMI:p=0.001). ROI1-r and ROI1-l FD values differed significantly between the patient and control groups (p=0.001, p=0.002 respectively), while FD measurements in ROI2-r/l and ROI3-r/l regions did not display a statistically meaningful difference between the patient and control groups (Table 2).
When we analyzed the distribution of MCI; C1 42.1%, C2 47.4%, C3 10.5% in the ED group; C1 73.7%, C2 26.3%, C3 0.0% in the control group. There was a statistically significant difference between the patient group with ED and the control group in terms of MCI (p=0.029). No significant difference was detected between MCI and other parameters (p>0.05).
Discussion
FA has gained popularity for the detection of potential abnormalities and assessment of the severity of the existing disorders in bone structure. FD calculated on two-dimensional radiographs is very beneficial in revealing changes in bone architecture and density.6,8 It is known that the bone structure of ED patients is different from healthy people and these differences play an important role in accurate diagnosis and treatment. For this reason, the need to determine the bone quality of patients with ED by a quantitative and easily applicable diagnostic method has emerged.2,9-10 In the current study, a statistically significant difference was observed between the ED and control groups in ROI1 and all FD values were higher in the control group than in the ED group. To the best of our knowledge, there is no previous study in the literature evaluating bone structure in patients with ED using FA.
In the study conducted by Demiralp et al.6 with DPR, it was reported that FD findings were higher in patients using bisphosphonates. Duyan Yüksel et al.11 reported that FD was lower in patients with phenylketonuria compared to the control group. Similarly, Gümüşsoy et al.12 found that FD was lower in patients with chronic renal failure compared to the control group. In this study, the mean FD was lower in patients with ED compared to the control group, and the FD measured in the region between the mandibular notch and mandibular foramen in these patients was statistically significantly different. The FD values may have decreased in ED patients due to dysfunction in the jaws caused by hypodontia or anodontia. In future studies, more comprehensive data can be obtained by comparing FD values before and after prosthodontic treatment.
In studies examining the effect of gender on FD, it is generally observed that FD values are lower in females than in males. Kayıpmaz et al.13 examined the trabecular structure of the condyle region with FA in CBCT images of 70 participants, 35 healthy individuals, and 35 patients with TMJ arthritis. It was concluded that females had smaller FA values than males. Arsan et al.8 investigated the trabecular structure of the mandibular condyle in a study using DPRs and FA and concluded that the mean FD value was higher in males than females. Alman et al.14 attributed the lower FD values of women to the increase in bone resorption due to the effect of prolactin and estrogen hormones. In this study, FD values in males were higher than in females and this result supports the literature. Higher FD values in males may be related to more complex trabecular structures.
In the literature, it is known that FD values are lower in older age groups.15 Ling et al.16 analyzed the trabecular bone structure with CBCT and reported a significant difference in fractal measurements in all age groups and genders. In Demiralp et al. study,6 there was no significant correlation between age and FD values of bisphosphonate users. In this study, no significant correlation was found between age and FD values.
Panoramic radiomorphometric indexes are one of the prediagnostic tools for osteoporotic changes. In prior studies, mandibular bone density has been reported to correlate well with overall skeletal bone mass, and panoramic radiomorphometric indexes have been used to predict the diagnosis of osteoporosis.17 As far as we know, there was no study in the literature comparing FD analysis with MI, PMI, and MCI index values in DPRs of patients with ED and healthy control subjects. Several studies have revealed that individuals with osteoporotic bone structure have lower MI values than healthy individuals, and patients with low MI values have been found to be affected and correlated with MCI.12,18-20 Hastar et al.21 in a study of 487 elderly patients revealed that the presence of teeth was statistically significantly associated with MI and PMI parameters and the MI and PMI values of edentulous patients were considerably lower; furthermore, according to tooth status, partially edentulous and edentulous patients had more osteoporosis. Gülşahi et al.22 found that dentition is an important parameter for MCI and that being edentulous or partially edentulous substantially raised the proportion of individuals in the C3 category compared to patients with full dentition. In the present study, it was statistically significant that the mean values of MI and PMI were lower in patients with ED compared to the healthy group. In MCI, the occurrence of C2 and C3 was observed at a high and significant rate in patients with ED. It was thought that this result developed due to resorption of the cortical bone in the lower jaw due to the lack of teeth in patients with ED.
The lack of dental support in patients with ED diminishes the functional stimulation of the jawbone. Removable prostheses are the most widely preferred treatment of choice in patients with EDs due to the simplicity of modification or replacement during growth. The optimal time for dental implant placement is still controversial.23 Prior to prosthetic treatment planning, we consider that evaluating the crest heights of patients with EDs with the help of radiomorphometric indexes will affect the treatment prognosis.
Limitations
The major limitation of this study is the limited number of patients included owing to the fact that it was a congenital defect, which prevented some relationships from reaching statistical significance. Another limitation of the current study is that we were not able to examine the effect of functional use on FA. Thus, it is recommended that further multicenter and multidisciplinary studies with a larger sample group should be conducted to examine the long-term effects of prosthodontic treatments.
Conclusion
In this study, the trabecular structure of the jawbone in patients with ED was analyzed and the differences in FD and radiomorphometric index were shown in comparison with the healthy control group. Using FA and PMI, MCI, and MI in DPR, which is one of the common radiographic methods in dentistry and maxillofacial imaging, plays an important role in the diagnosis, prosthetic treatment, and follow-up of patients with ED.
Declarations
Animal and Human Rights Statement
All procedures performed in this study were in accordance with the ethical standards of the institutional and/or national research committee and with the 1964 Helsinki Declaration and its later amendments or comparable ethical standards.
Informed Consent
Informed consent was waived by the Ethics Committee due to the retrospective nature of the study.
Data Availability
The datasets used and/or analyzed during the current study are not publicly available due to patient privacy reasons but are available from the corresponding author on reasonable request.
Conflict of Interest
The authors declare that there is no conflict of interest.
Funding
None.
Abbreviations
DPR: Dental panoramic radiograph
ED: Ectodermal dysplasia
FA: Fractal analysis
FD: Fractal dimension
MCI: Mandibular cortical index
MI: Mental index
PMI: Panoramic mandibular index
ROI: Region of interest
SPSS: Statistical Package for the Social Sciences
References
- Yavuz I, Callea M, Yavuz Y, Goncharuk-Khomyn M. Dental implants survival rates among ectodermal dysplasia patients: aggregation and synthesis of literature data. Ukrainian Dent J. 2023;2:71-77. doi:10.56569/udj.2.1.2023.71-77
- Reyes-Reali J, Mendoza-Ramos MI, Garrido-Guerrero E, Méndez-Catalá CF, Méndez-Cruz AR, Pozo-Molina G. Hypohidrotic ectodermal dysplasia: clinical and molecular review. Int J Dermatol. 2018;57(8):965-972.
- Sari ME, Duran I, Ibis S. Dental implant patients with ectodermal dysplasia: current approaches. J Int Dent Med Res. 2015;8(3):147.
- Akyol S, Aras A, Dogan M. Evaluation of pneumatized articular eminence and glenoid fossa on CBCT in a group of Turkish children. Balkan Med J. 2021;31(2):168-175. doi:10.1016/j.pdj.2021.05.002
- Kim OS, Shin MH, Song IH, et al. Digital panoramic radiographs are useful for diagnosis of osteoporosis in Korean postmenopausal women. Gerodontology. 2016;33(2):185-192. doi:10.1111/ger.12134
- Demiralp KÖ, Kurşun-Çakmak EŞ, Bayrak S, Akbulut N, Atakan C, Orhan K. Trabecular structure designation using fractal analysis technique on panoramic radiographs of patients with bisphosphonate intake: a preliminary study. Oral Radiol. 2019;35(1):23-28. doi:10.1007/s11282-018-0321-4
- Gulec M, Tassoker M, Ozcan S, Orhan K. Evaluation of the mandibular trabecular bone in patients with bruxism using fractal analysis. Oral Radiol. 2021;37(1):36-45. doi:10.1007/s11282-020-00422-5
- Arsan B, Köse TE, Çene E, Özcan İ. Assessment of the trabecular structure of mandibular condyles in patients with temporomandibular disorders using fractal analysis. Oral Surg Oral Med Oral Pathol Oral Radiol. 2017;123(3):382-391. doi:10.1016/j.oooo.2016.11.005
- Yavuz Y, Akleyin E, Akdağ MZ, Çolak M, Doğan MS, Kotanlı S. Clinical and radiological findings, SEM analysis, and evaluation of caries risk in ectodermal dysplasia cases. Biotechnol Biotechnol Equip. 2022;36(1):193-199. doi:10.1080/13102818.2022.2061374
- Temur KT, Magat G, Cukurluoglu A, Onsuren AS, Ozcan S. Evaluation of mandibular trabecular bone by fractal analysis in pediatric patients with hypodontia of the mandibular second premolar tooth. BMC Oral Health. 2024;24(1):1005. doi:10.1186/s12903-024-04766-w
- Yüksel HD, Çabuk DS, Çabuk Aİ, Evlice B. Evaluation of mandibular bone structure changes in patients with phenylketonuria through fractal analysis and radiomorphometric indices. Oral Surg Oral Med Oral Pathol Oral Radiol. 2025;139(2):242-247.
- Gumussoy I, Miloglu O, Cankaya E, Bayrakdar IS. Fractal properties of the trabecular pattern of the mandible in chronic renal failure. Dentomaxillofac Radiol. 2016;45(5):20150389. doi:10.1259/dmfr.20150389
- Kayipmaz S, Akçay S, Sezgin ÖS, Çandirli C. Trabecular structural changes in the mandibular condyle caused by degenerative osteoarthritis: a comparative study by cone-beam computed tomography imaging. Oral Radiol. 2019;35(1):51-58. doi:10.1007/s11282-018-0324-1
- Alman A, Johnson L, Calverley D, Grunwald G, Lezotte D, Hokanson J. Diagnostic capabilities of fractal dimension and mandibular cortical width to identify men and women with decreased bone mineral density. Osteoporos Int. 2012;23(5):1631-1636. doi:10.1007/s00198-011-1678-y
- Temur K, Magat G, Cosgunarslan A, Ozcan S. Evaluation of jaw bone change in children and adolescents with rheumatic heart disease by fractal analysis. Niger J Clin Pract. 2024;27(2):260-267. doi:10.4103/njcp.njcp_346_23
- Ling H, Yang X, Li P, Megalooikonomou V, Xu Y, Yang J. Cross gender-age trabecular texture analysis in cone beam CT. Dentomaxillofac Radiol. 2014;43(4):20130324. doi:10.1259/dmfr.20130324
- Mostafa RA, Arnout EA, Abo El-Fotouh MM. Feasibility of cone beam computed tomography radiomorphometric analysis and fractal dimension in assessment of postmenopausal osteoporosis in correlation with dual x-ray absorptiometry. Dentomaxillofac Radiol. 2016;45(7):20160212. doi:10.1259/dmfr.20160212
- Dagistan S, Bilge O. Comparison of antegonial index, mental index, panoramic mandibular index, and mandibular cortical index values in the panoramic radiographs of normal males and male patients with osteoporosis. Dentomaxillofac Radiol. 2010;39(5):290-294. doi:10.1259/dmfr/46589325
- Leite AF, de Souza Figueiredo PT, Barra FR, de Melo NS, de Paula AP. Relationships between mandibular cortical indexes, bone mineral density, and osteoporotic fractures in Brazilian men over 60 years old. Oral Surg Oral Med Oral Pathol Oral Radiol Endod. 2011;112(5):648-656. doi:10.1016/j.tripleo.2011.06.014
- Alonso MBC, Cortes AR, Camargo AJ, Arita ES, Haiter-Neto F, Watanabe PCA. Assessment of panoramic radiomorphometric indices of the mandible in a Brazilian population. ISRN Rheumatol. 2011;2011:854287. doi:10.5402/2011/854287
- Hastar E, Yilmaz HH, Orhan H. Evaluation of mental index, mandibular cortical index, and panoramic mandibular index on dental panoramic radiographs in the elderly. Eur J Dent. 2011;5(1):60-67. doi:10.1055/s-0039-1698859
- Gulsahi A, Yuzugullu B, Imirzalıoglu P, Genc Y. Assessment of panoramic radiomorphometric indices in Turkish patients of different age groups, gender, and dental status. Dentomaxillofac Radiol. 2008;37(5):288-292. doi:10.1259/dmfr/19491030
- Clarke L, Bowyer L, Noone J, Stevens C, Yates J, Ashley M. Britain’s youngest implant patients? A case series of implant treatment in children with ectodermal dysplasia. Oral Surg. 2020;13(3):245-251. doi:10.1111/ors.12479
Tables
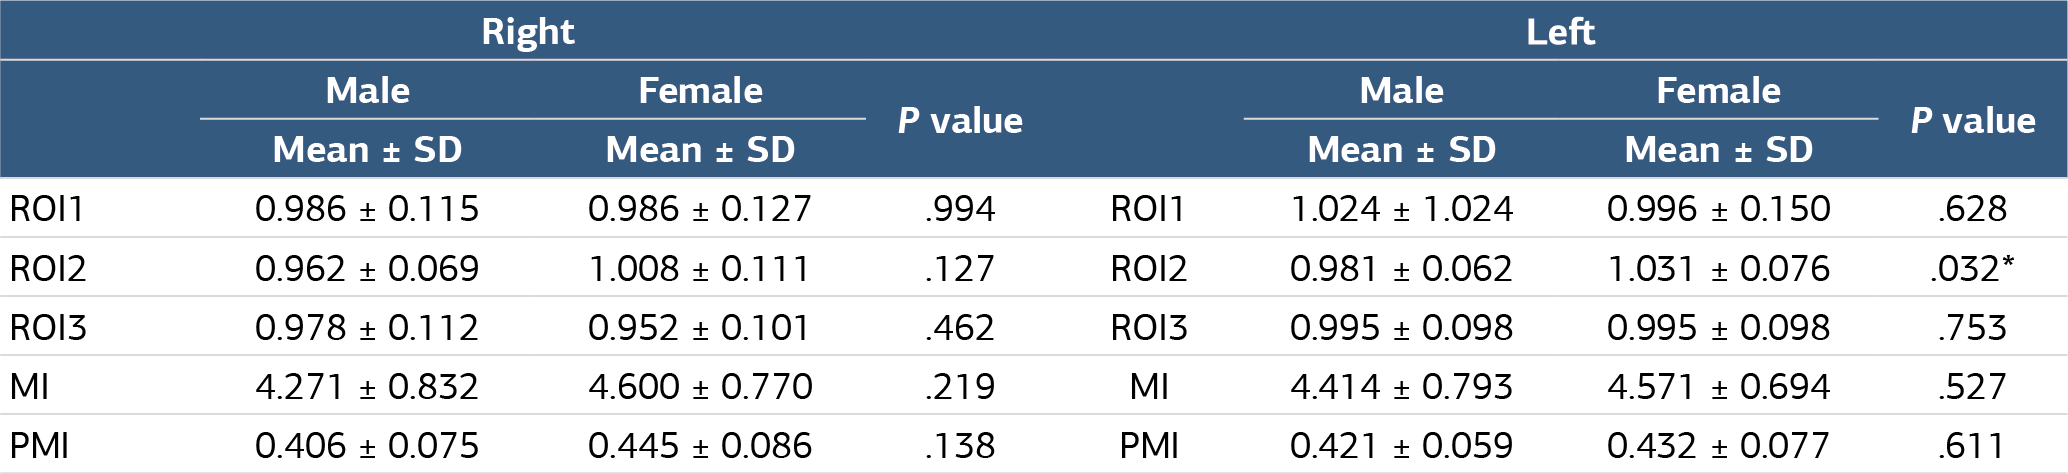
Table 2. Comparison of FD analysis, PMI, and MI values between ectodermal dysplasia group and control groups
S.D.: Standart Deviation, p
Figures
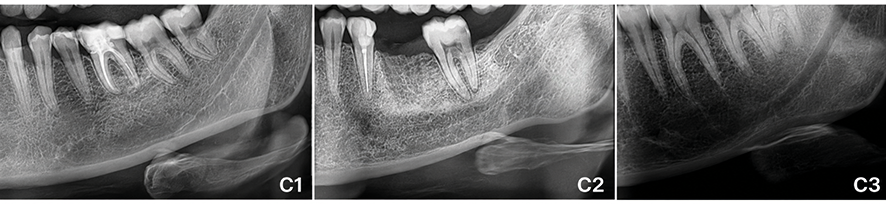
Figure 1. The MCI classification categorizes the endosteal margin of the mandibular cortex as below: C1: smooth and sharp, C2: the presence of lacunar resorption cavities, and C3: markedly porous and severely eroded
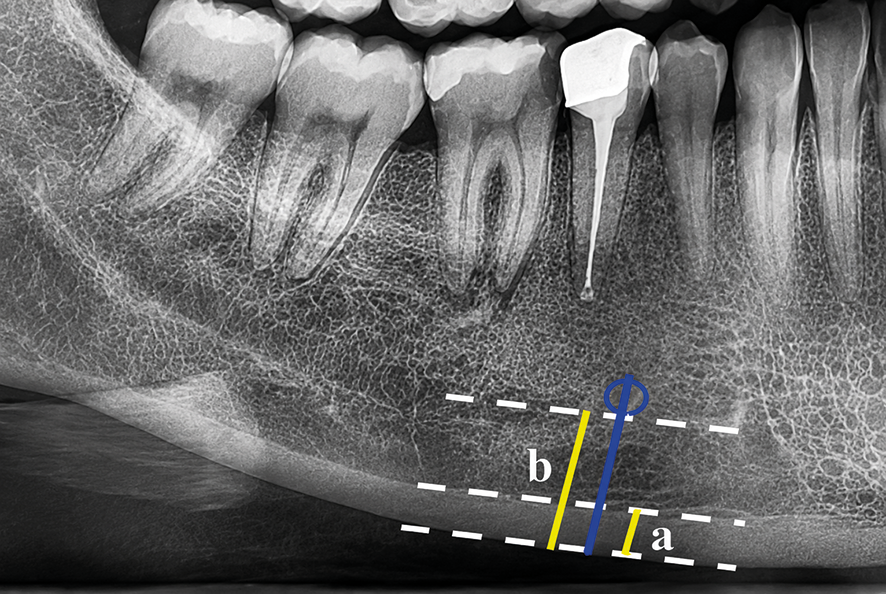
Figure 2. Measurements of MI and PMI. MI was measured from a line drawn through the center of the mental foramen and perpendicular to the tangent of the inferior margin of the mandibular cortex (a). The ratio of MI to the distance between the lower border of the mental foramen and the inferior border of the mandibular cortex was calculated as PMI (a/b)
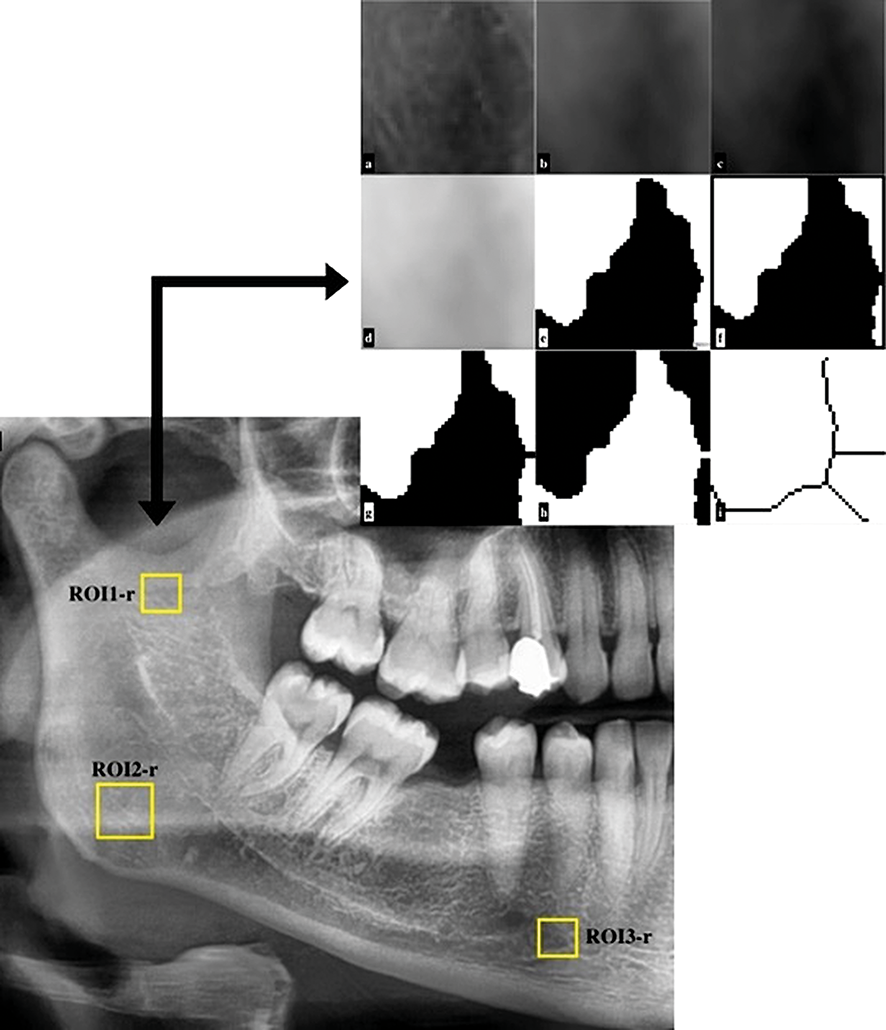
Figure 3. Fractal analysis steps. a: Duplicated version of ROI. b: Gaussian blur. c: Subtraction. d: Addition of 128 gray values. e: Binarization version. f: Erosion version. g: Dilation version. h: Inversion version. i: Skeletonization
Additional Information
Publisher’s Note
Bayrakol MP remains neutral with regard to jurisdictional and institutional claims.
Rights and Permissions

This work is licensed under a Creative Commons Attribution-NonCommercial 4.0 International License (CC BY-NC 4.0). To view a copy of the license, visit https://creativecommons.org/licenses/by-nc/4.0/
About This Article
How to Cite This Article
Elif Meltem Aslan, Sedef Kotanlı, Aslıhan Artaş, Mehmet Veysel Kotanlı. Evaluation of mandibular bone structure in patients with ectodermal dysplasia. Ann Clin Anal Med 2025;16(Suppl 1):64-68. doi:10.4328/ACAM.22633
Publication History
- Received:
- 05.03.2025
- Accepted:
- 24.03.2025
- Published Online:
- 25.03.2025
- Printed:
- 25.03.2025