
Abstract
AimEmergency laboratories require rapid, reliable test results to ensure patient safety, particularly for critical cardiac parameters. Six Sigma methodology offers an objective approach to assessing analytical performance by integrating precision, bias, and total allowable error. This study aimed to evaluate the analytical performance of high-sensitivity troponin T (Hs-TnT), creatine kinase-MB (CK-MB), and N-terminal pro–B-type natriuretic peptide (NT-proBNP) utilizing sigma metrics on two automated analyzers.MethodsThis study was conducted in the Clinical Biochemistry Laboratory of Ankara Etlik City Hospital using internal quality control (IQC) and external quality control (EQC) data collected between July and December 2024. Sigma metrics were calculated for Hs-TnT, CK-MB, and NT-proBNP on two Roche Cobas 8000 e801 analyzers. CV%, bias%, and TEa values (Clinical Laboratory Improvement Amendments [CLIA] 2025) were used to compute sigma. Quality goal index (QGI) was used to further explore sources of analytical error when sigma values were below 3.ResultsHs-TnT demonstrated excellent performance (σ ≥ 6) on both analyzers at Level 2, while NT-proBNP showed excellent performance on Analyzer A at Level 1. No analyte exhibited poor performance (σ < 3) on either analyzer. CK-MB displayed adequate to good performance depending on the analyzer and control level. QGI results supported that none of the biomarkers showed error patterns indicative of critical analytical problems.ConclusionHs-TnT, NT-proBNP, and CK-MB demonstrated acceptable-to-excellent analytical performance according to Sigma metrics, confirming their reliability in emergency laboratory settings. Sigma methodology is a fundamental approach for evaluating analytical performance, especially for critical tests. Ongoing assessment and verification ensure analytical quality and reliable results for clinical decision-making.
Keywords
Introduction
“First, do no harm (primum non nocere)” as emphasized in the Hippocratic Oath, underscores that patient safety is fundamental to high-quality health care, with the ultimate goal of achieving zero preventable harm to patients. The World Health Organization (WHO) defines patient safety as “a framework of organized activities that creates cultures, processes, procedures, behaviors, technologies, and environments in health care that consistently and sustainably lower risks, reduce the occurrence of avoidable harm, make errors less likely, and reduce their impact when they do occur.” This definition reflects the proactive and systemic approach required to ensure the highest standards of healthcare.1,2
In the modern era, the demand for high-quality and rapid healthcare services has significantly increased, particularly in emergency and critical care settings, where laboratory test results directly influence clinical decision-making.3,4
Delayed or inaccurate emergency laboratory test results can lead to misdiagnosis, delayed treatment, or even inappropriate therapeutic interventions, all of which compromise patient safety. Therefore, it is essential to implement stricter quality assurance and control procedures in emergency laboratories to ensure the accuracy, timeliness, and reliability of results.5-7
In this context, the Six Sigma methodology provides a comprehensive framework for performance evaluation, offering an integrated assessment of analytical quality by incorporating precision, bias, and total allowable error (TEa).8 Its effectiveness in promoting continuous quality improvement is well documented, as it enables laboratories to maintain analytical reliability, reduce error rates, and align performance with clinical and regulatory expectations.9 Consequently, the Sigma metric serves as a unique and powerful tool that links analytical robustness to broader goals of patient safety and laboratory efficiency.10 The Sigma values are calculated with the formulation. The corresponding Sigma values express the following performance levels: poor performance (<3) indicating inadequate quality; appropriate quality necessitating stringent control measures (3–3.99); good quality (4–4.99); very good quality (5–5.99); and excellent (≥6) representing world-class performance.11 Nevertheless, analytical performances ranging between 3 and 4 Sigma have been frequently reported in laboratory medicine, emphasizing the need for continuous quality monitoring and process optimization.12,13
High-sensitivity troponin T (Hs-TnT), creatine kinase-MB (CK-MB), and N-terminal pro-B-type natriuretic peptide (NT-proBNP) play a pivotal role in the diagnosis and management of cardiovascular diseases, guiding clinicians in the early detection and treatment of myocardial injury and heart failure. As these biomarkers are widely used in emergency departments and critical care units, analytical inaccuracies can lead to delayed diagnosis, unnecessary procedures, or missed opportunities for timely intervention.14 Therefore, assessing their analytical performance using Six Sigma methodology is essential not only for maintaining laboratory standards but also for enhancing patient safety. Despite its widespread application in clinical chemistry assays, the analytical performance of cardiac biomarkers has been evaluated in a limited number of studies using the Six Sigma methodology.
The objective of this study was to evaluate and compare the analytical performance of Hs-TnT, CK-MB (mass assay), and NT-proBNP assays between two analyzers based on Six Sigma metrics, with the aim of elucidating inter-analyzer variability.
Materials and Methods
Sigma metrics were calculated using internal quality control (IQC) and external quality control (EQC) data between July and December 2024. The study evaluated the IQC and EQC data of CK-MB, hs-Troponin T, and NT-proBNP parameters obtained from two fully automated emergency laboratory analyzers (Analyzer A and Analyzer B), on which the quality controls were run. All analyses were performed on the Cobas 8000 e801 analyzers (Roche Diagnostics, Germany) using the electrochemiluminescence immunoassay (ECLIA) method.
IQC data were collected daily from the analyzers at two control levels, representing both normal and pathological ranges (PreciControl, Roche Diagnostics, Germany). For each parameter, the mean and standard deviation (SD) values generated by the analyzers were recorded. Additionally, the manufacturer-assigned reference ranges and target mean concentrations for each analyte were taken into account during the evaluation. For NT-proBNP, Level 1 (L1) controls ranged between 105.7–152.2 pg/mL with a target mean of 129 pg/mL, while Level 2 (L2) controls ranged between 3499–5035 pg/mL with a target mean of 4267 pg/mL. For Hs-TnT, L1 controls were within 18.9–32.8 ng/L with a mean concentration of 25.9 ng/L, and L2 controls were within 1792–2422 ng/L with a mean of 2107 ng/L. For CK-MB, the L1 range was 4.02–7.01 µg/L with a mean of 5.5 µg/L, whereas L2 controls ranged from 37.5–69.8 µg/L with a mean of 53.7 µg/L. Data sets with missing or outlier values were excluded during the preliminary evaluation to ensure data quality.
To assess the analytical performance of each parameter at both control levels, bias (%), coefficient of variation (CV%), and sigma metrics were calculated.
The coefficient of variation (CV), which expresses the ratio of the standard deviation (SD) to the mean of a data set as a percentage, was calculated using the following formula: CV (%) = (SD/mean) × 100
Bias (%) was calculated using data obtained from the OneWorld Accuracy (Türkiye) external quality assessment program. The results reported by our laboratory were compared with the mean values of peer laboratories within the same cycle. The following formula was applied for the calculation of bias: Bias (%) = ([Our laboratory’s EQC result – Peer group EQC mean]/Peer group EQC mean) × 100
The total allowable error (TEa) for each parameter was determined based on the acceptable performance limits reported by the Clinical Laboratory Improvement Amendments (CLIA) 2025.15 Using these values, the Six Sigma metric was calculated with the following formula: Sigma (σ) = (TEa% –Bias%)/CV%.
The mean sigma value was calculated for each control level using the six-month average CV% and Bias% values.
Quality goal index (QGI) was calculated for all analytes; however, if any parameter demonstrated a sigma value below 3, the index was used to further investigate the underlying source of analytical error. QGI indicates whether analytical error arises from imprecision, bias, or a combination of both. It was calculated using the following formula: QGI = %Bias/(1.5 × %CV)
A QGI < 0.8 indicated imprecision as the main contributor to poor performance, a QGI > 1.2 suggested inaccuracy, and values between 0.8 and 1.2 implied that both factors were involved.16Ethical ApprovalThis study was approved by the Ethics Committee of Ankara Etlik City Hospital, University of Health Sciences (Date: 14.05.2025, Decision No: AEŞH-BADEK-2025-175).Statistical AnalysisAll calculations, including coefficient of variation (CV), bias, sigma metrics, and quality goal index (QGI), were performed using Microsoft Office Excel (Microsoft Corp., Redmond, WA, USA).Reporting GuidelinesThis study is reported in accordance with the STROBE guidelines.
Results
Table 1 presents the CV%, bias%, and sigma metrics for NT-proBNP, Hs-TnT, and CK-MB regarding the two analyzers. The findings varied depending on the analyte and control level.
Excellent analytical performance (sigma value, σ ≥ 6) was achieved for Hs-TnT on both Analyzer A and Analyzer B at IQC Level 2, as well as for NT-proBNP on Analyzer A at IQC Level 1. No parameter on either analyzer demonstrated poor analytical performance (sigma value, σ < 3) at any IQC level.
Table 2 presents the Sigma performance categories, QGI values, and the corresponding Westgard QC rules for NT-proBNP, Hs-TnT, and CK-MB across the two analyzers.
Along with the calculation of the Sigma metric, the Normalized Sigma Metric Method Decision Chart was applied to both analyzers to graphically summarize their analytical performance (Figures 1 and 2).
Discussion
Minimizing errors in clinical laboratories is crucial for patient safety. Analytical performance must be observed regularly to secure reliable results, particularly for urgent cardiac biomarkers. Six Sigma methodology offers an effective framework for this assessment. Hs-TnT, NT-proBNP, and CK-MB are commonly used cardiac biomarkers with critical roles in diagnosing and managing acute cardiovascular conditions. According to the 2023 ESC guidelines, Hs-TnT is incorporated into accelerated diagnostic pathways using clearly defined decision limits: values below 5–6 ng/L support ruling out myocardial infarction, while levels of 52 ng/L or higher support ruling it in.17 Similarly, the ESC heart failure guidelines recommend an NT-proBNP level below 300 pg/mL to rule out acute heart failure, with age-adjusted thresholds informing rule-in decisions.18 While CK-MB has a diminished role in contemporary diagnostic algorithms, it remains clinically valuable in specific scenarios, particularly for evaluating suspected reinfarction or when analytical interference may affect assay accuracy.
Within this clinical context, our study assessed the analytical performance of these three biomarkers using Six Sigma metrics. Both NT-proBNP and Hs-TnT demonstrated good performance across the two analyzers, whereas CK-MB exhibited performance ranging from adequate to good, depending on the analyzer. These sigma values indicate that the cardiac biomarkers used in our study present a high level of analytical performance. This is particularly important, as Hs-TnT plays a critical role in the diagnosis of acute myocardial infarction, whereas NT-proBNP is essential for the diagnostic assessment of heart failure. Therefore, confirming the strong analytical performance of these assays supports the reliability of the clinical decision-making processes in which they are employed.
Although the literature on cardiac biomarkers is limited, previous studies have reported sigma values below three for markers such as cTnl, CK-MB mass, and Myoglobin, highlighting the need for process optimization.19 Likewise, Eraldemir et al. demonstrated that Sigma performance varies substantially depending on the selected TEa source, with CK-MB reaching values above six, whereas NT-proBNP and Hs-TnT occasionally fell into poor-quality ranges.20 Üstündağ et al. also reported Sigma levels below two for BNP using both internal and external quality control data.21 In our study, however, none of the evaluated cardiac biomarkers exhibited poor-quality sigma levels, indicating comparatively more consistent analytical performance.
Accurate evaluation of assay performance requires determination of bias and CV at clinically meaningful medical decision levels. Cardiac biomarkers have specific clinical decision thresholds—such as the Hs-TnT rule-out limit and the NT-proBNP acute rule-out threshold—at which analytical reliability is most critical. Accordingly, assessing Sigma metrics at these concentrations provides a more clinically meaningful evaluation of assay performance than analyses restricted to routine QC levels. Estimating bias accurately remains a significant challenge, since many EQA materials are not fully commutable and may not truly reflect real-world clinical performance.22 Moreover, it should be acknowledged that QC materials may not reliably reproduce the analytical behavior of actual patient samples.
Recent literature highlights the growing adoption and utility of Sigma-metrics in routine laboratory practice. A 2024 survey from the Netherlands described a three-tier structure for internal QC design: (1) QC based solely on analytical characteristics, (2) Sigma metric–guided QC rule selection, and (3) risk-based QC systems that extend the Sigma concept.23,24 In this context, Sigma values serve as a practical tool for determining QC frequency and selecting appropriate Westgard rules. Based on our Sigma findings, assays with σ ≥ 6 should be monitored using minimal QC rules (1₃s), those with σ 4–6 require moderate multirule strategies (1₃s/2₂s/R₄s), and those with σ <4 necessitate more stringent rules and more frequent QC cycles (1₃s/2₂s/R₄s/4₁s/8ₓ). This approach supports risk-adapted QC planning and ensures that lower-performing tests receive proportionally greater oversight, ultimately improving analytical quality and patient safety.
Although there are ongoing debates about its use, the Six Sigma approach still provides laboratories with a clear and practical way to monitor analytical quality. It helps laboratories quickly analyze their test performance, supports risk-based QC planning, and enables corrective action on low-performing tests. This balanced allocation of resources allows for time and cost savings while preserving patient safety.
Limitations
Our study has several limitations, including variability between reagent and QC lots, analyzer-specific factors, its single-center design, and the relatively short six-month duration, which may not fully reflect long-term assay performance. Future studies should include longer follow-up, more centers, and clinical outcome data to build a stronger picture of sigma performance.
Conclusion
In conclusion, laboratories should regularly assess their analytical performance with sigma metrics, especially for critical cardiac biomarkers. Regular monitoring helps protect quality standards and ensures that clinicians have timely and accurate results to guide patient care.
Declarations
Animal and Human Rights Statement
All procedures performed in this study were in accordance with the ethical standards of the institutional and/or national research committee and with the 1964 Helsinki Declaration and its later amendments or comparable ethical standards.
Informed Consent
Informed consent was waived due to the retrospective nature of the study and the use of anonymized data.
Data Availability
The datasets used and/or analyzed during the current study are not publicly available due to patient privacy reasons, but are available from the corresponding author on reasonable request.
Conflict of Interest
The authors declare no conflict of interest.
Funding
None.
Author Contributions (CRediT Taxonomy)
Conceptualization: E.B.G.A., F.U., A.S.
Methodology: E.B.G.A., F.U., A.S.
Investigation: E.B.G.A., F.U., A.S.
Data curation: E.B.G.A., A.S.
Formal analysis: E.B.G.A., F.U., A.S.
Software: F.U., A.S.
Validation: F.U., A.S.
Writing - original draft: E.B.G.A., F.U., A.S.
Writing - review & editing: E.B.G.A., F.U., A.S.
Visualization: A.S.
Supervision: E.B.G.A., F.U.
Project administration: E.B.G.A., F.U.
Funding acquisition: E.B.G.A. Final approval of the manuscript: All authors
AI Usage Disclosure
The authors declare that no AI-assisted technologies were used.
Abbreviations
BNP: B-type natriuretic peptide
CK-MB: creatine kinase–MB
CLIA: Clinical laboratory improvement amendments
CV: Coefficient of variation
ECLIA: Electrochemiluminescence immunoassay
EQC: External quality control
ESC: European society of cardiology
IQC: Internal quality control
L1: Level 1
L2: Level 2
QC: Quality control
QGI: Quality goal index
SD: Standard deviation
STROBE: Strengthening the reporting of observational studies in epidemiology
WHO: World health organization
References
- Domer G, Gallagher TM, Shahabzada S, et al. Patient safety: preventing patient harm and building capacity for patient safety. In Contemporary topics in patient safety-volume 1. IntechOpen.. 2021.
- World Health Organization. What is patient safety? [Internet]. World Health Organization; 2021 [cited 2025 Jun 25]. Available from: https://www.who.int/health-topics/patient-safety
- Zhang L, Liu ZH, Lv YJ, Fu S, Luo ZM, Guo ML. Comprehensive improvements in the emergency laboratory test process based on information technology. BMC Med Inform Decis Mak. 2023;23(1):292. doi:10.1186/s12911-023-02387-x
- Adekoya A, Ogunkeye O, Balogun R. Medical laboratories in healthcare delivery: a systematic review of their roles and impact. Laboratories. 2025;2(1):8. doi:10.3390/laboratories2010008
- Ngo A, Gandhi P, Miller WG. Frequency that laboratory tests influence medical decisions. J Appl Lab Med. 2017;1(4):410-414. doi:10.1373/jalm.2016.021634
- Dawande PP, Wankhade RS, Akhtar FI, Noman O. Turnaround time: an efficacy measure for medical laboratories. Cureus. 2022;14(9):e28824. doi:10.7759/cureus.28824
- Ling L, Lee J, Choi J, et al. The effect of laboratory testing on emergency department length of stay: a multihospital longitudinal study applying a cross-classified random-effect modeling approach. Acad Emerg Med. 2015;22(1):38-46. doi:10.1111/acem.12565
- Sawalakhe PV, Desmukh SV, Lakhe RR. Evaluating performance of testing laboratory using Six Sigma. Int J Innov Eng Sci. 2016;1(1):13-20.
- Charuruks N. Sigma metrics across the total testing process. Clin Lab Med. 2017;37(1):97-117. doi:10.1016/j.cll.2016.09.009
- Westgard S. Prioritizing risk analysis quality control plans based on sigma-metrics. Clin Lab Med. 2013;33(1):41-53. doi:10.1016/j.cll.2012.11.008
- Ozdemir S, Ucar F. Determination of sigma metric based on various TEa sources for CBC parameters: the need for sigma metrics harmonization. J Lab Med. 2022;46(2):133-141. doi:10.1515/labmed-2021-0116
- Plebani M. The CCLM contribution to improvements in quality and patient safety. Clin Chem Lab Med. 2013;51(1):39-46. doi:10.1515/cclm-2012-0094
- Miller JJ. A novel approach for routinely assessing laboratory sigma metrics for a broad range of automated assays. J Appl Lab Med. 2024;9(3):477-492. doi:10.1093/jalm/jfad125
- Netala VR, Teertam SK, Li H, Zhang Z. A comprehensive review of cardiovascular disease management: cardiac biomarkers, imaging modalities, pharmacotherapy, surgical interventions, and herbal remedies. Cells. 2024;13(17):1471. doi:10.3390/cells13171471
- Clinical Laboratory Improvement Amendments (CLIA). Acceptance limits for proficiency testing [Internet]. 2025 [cited 2025 Jun 25]. Available from: https://westgard.com
- Kumar BV, Mohan T. Sigma metrics as a tool for evaluating the performance of internal quality control in a clinical chemistry laboratory. J Lab Physicians. 2018;10(2):194-199. doi:10.4103/JLP.JLP_102_17
- Byrne RA, Rossello X, Coughlan JJ, et al. 2023 ESC guidelines for the management of acute coronary syndromes. Eur Heart J. 2023;44(38):3720-3826. doi:10.1093/eurheartj/ehad191
- McDonagh TA, Metra M, Adamo M, et al. 2023 focused update of the 2021 ESC guidelines for the diagnosis and treatment of acute and chronic heart failure. Eur Heart J. 2023;44(37):3627-3639. doi:10.1093/eurheartj/ehad195
- Kader S. Evaluation of analytical quality of cardiac biomarkers in the emergency laboratory by sigma metric. Int J Sci Technol Res. 2019;5(9):34-38. doi:10.7176/JSTR/5-9-05
- Eraldemir FC. Evaluation of analytical quality of cardiac biomarkers in the emergency laboratory by sigma metrics. J Clin Anal Med. 2019;10(1):35-40. doi:10.4328/JCAM.6003
- Ustundag Y, Huysal K, Eris C, Dulger S, Eren SE, Yavuz S. Evaluation of sigma value and quality goal index for brain natriuretic peptide test. Int J Med Biochem. 2020;3(3):178-182. doi:10.14744/ijmb.2020.74046
- Yadav D, Rathore M, Banerjee M, Tomo S, Sharma P. Beyond the basics: sigma scores in laboratory medicine with variable total allowable errors (TEa). Clin Chim Acta. 2025;565:119971. doi:10.1016/j.cca.2024.119971
- Van Rossum HH, van Schrojenstein Lantman M, Severens M, et al. Quality control in the Netherlands: today’s practices and starting points for guidance and future research. Clin Chem Lab Med. 2024;62(11):2177-2184. doi:10.1515/cclm-2024-0316
- Bayat H, Westgard SA, Westgard JO. The value of sigma-metrics in laboratory medicine. Clin Chem Lab Med. 2024;62(12):2401-2404. doi:10.1515/cclm-2024-0609
Tables
Table 1. Average Results Over Six Months for Both Analysers Regarding Control Levels 1 and 2
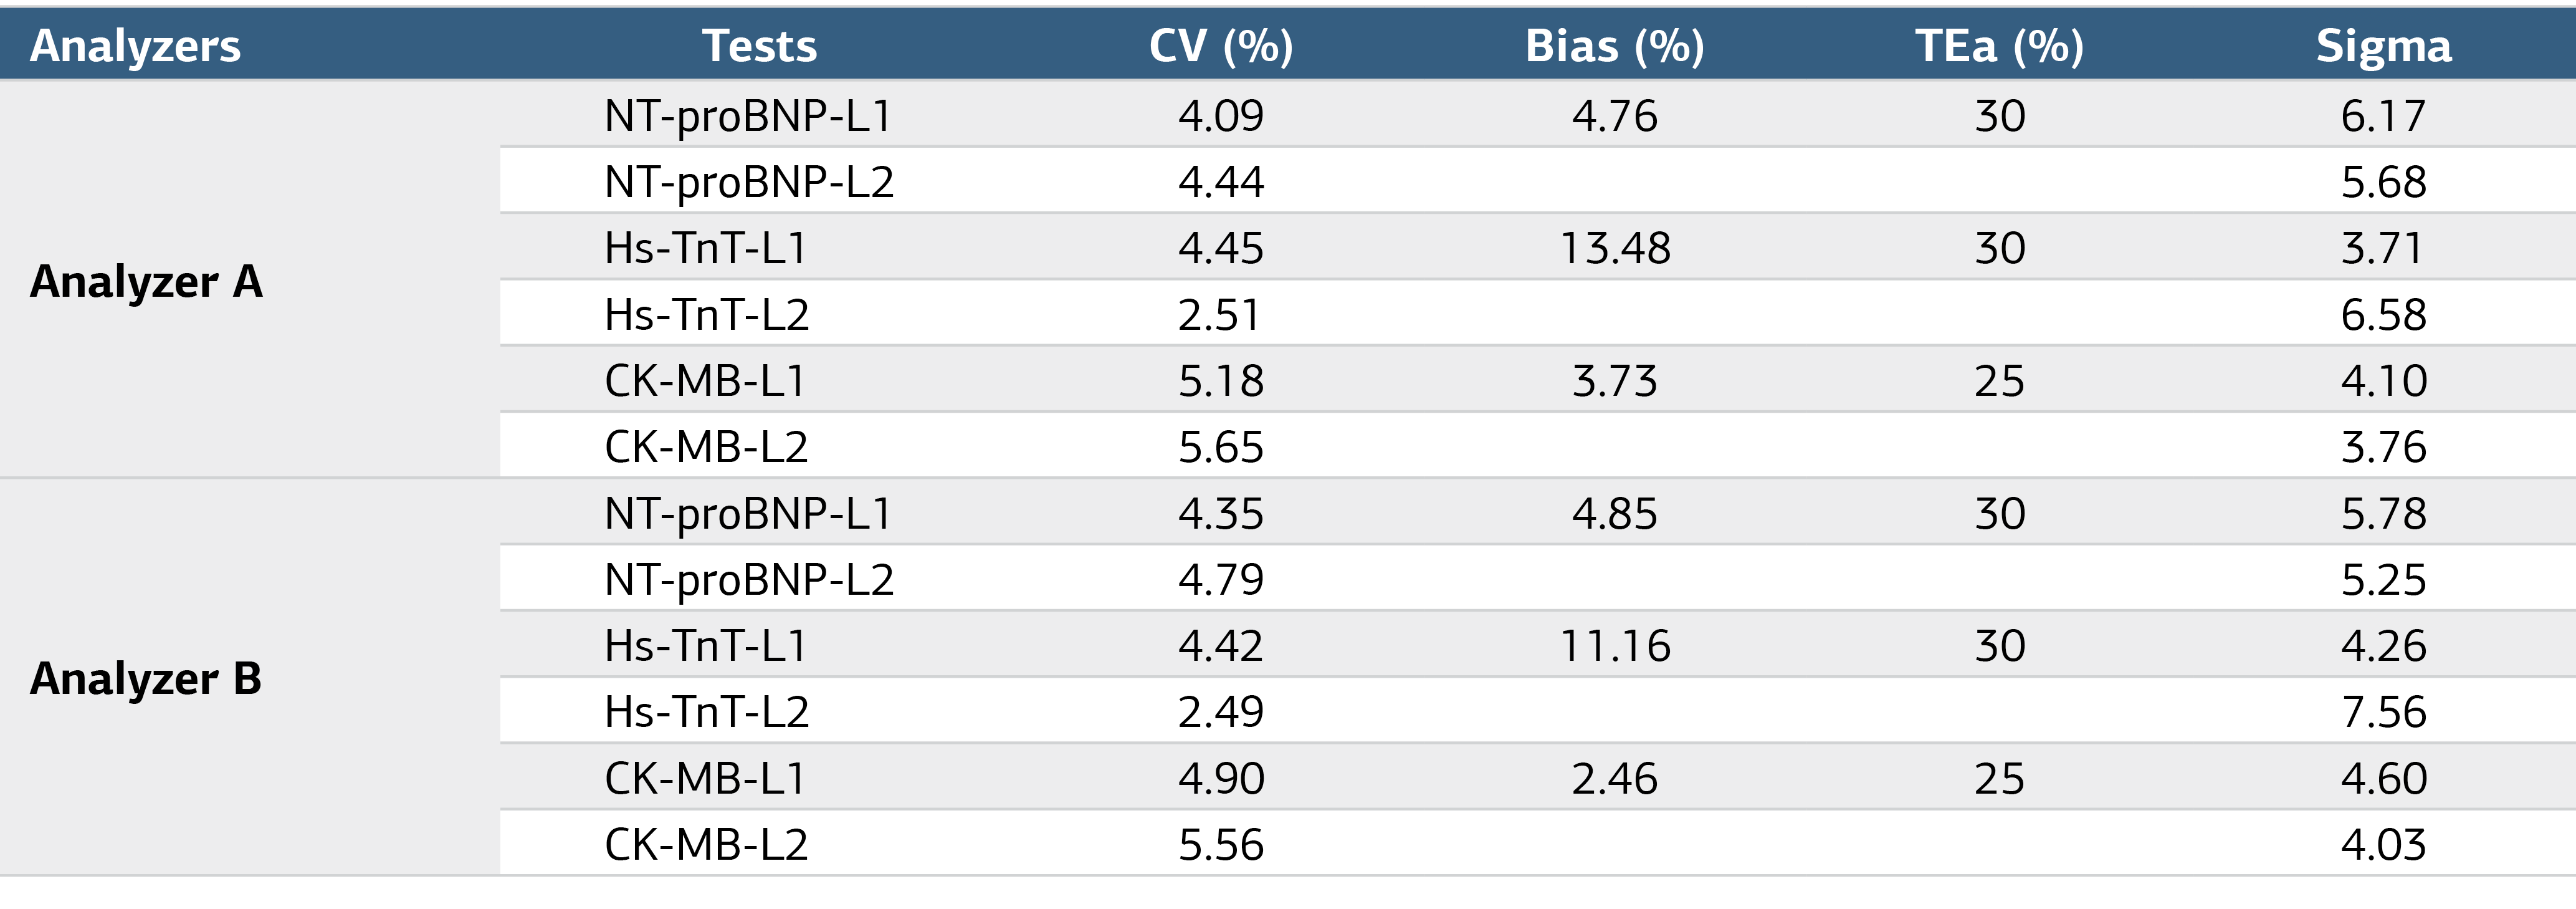
Abbreviations; CV, Coefficient of variation; TEa, Total allowable error; NT-proBNP, N-terminal pro–B-type Natriuretic Peptide; Hs-TnT, High-sensitivity Troponin T; CK-MB, Creatine Kinase–MB; L1, Level 1; L2, Level 2
Table 2. Sigma Metrics, Quality Goal Index (QGI), Performance Categories, and Recommended Westgard QC Rules for Cardiac Biomarkers Across Two Analyzers
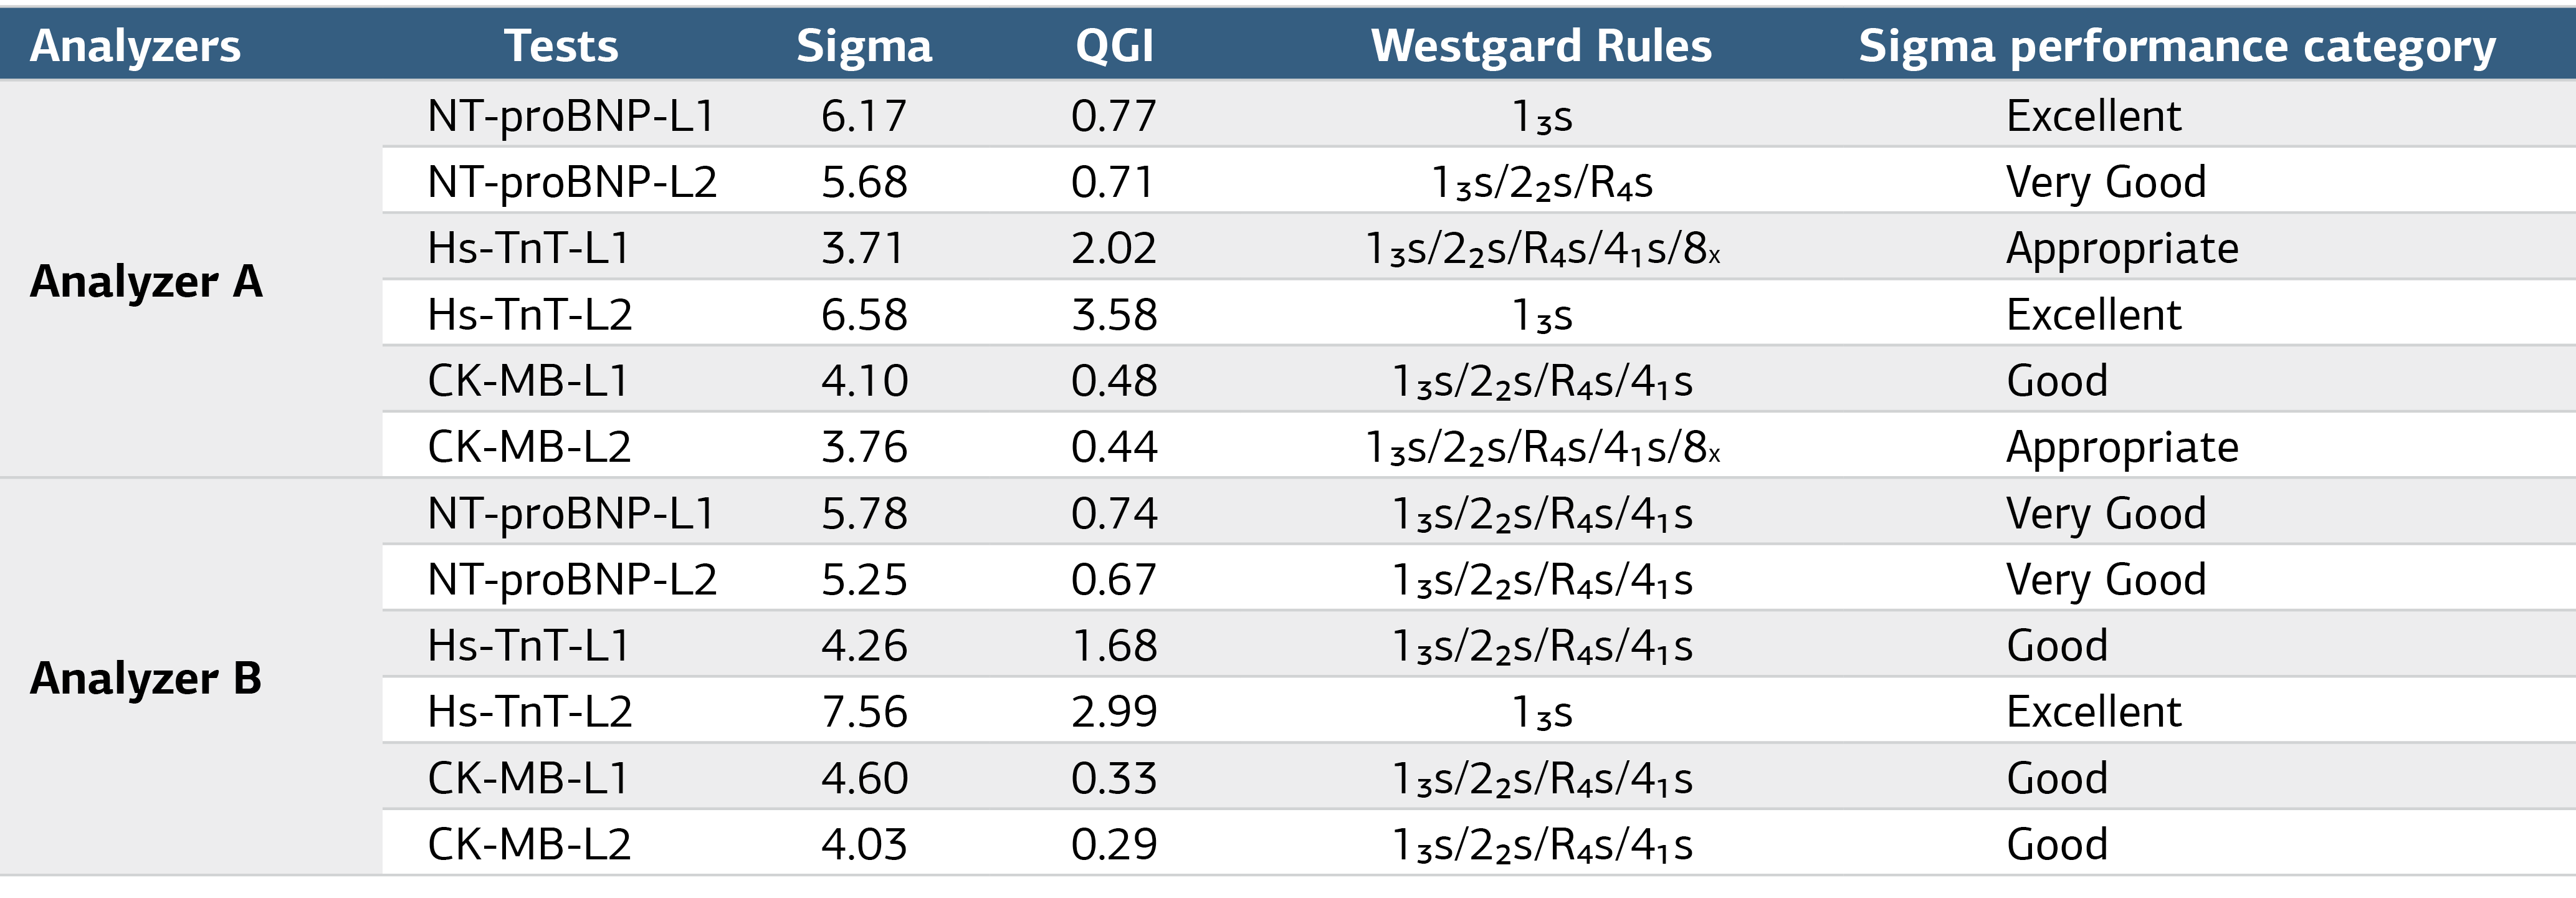
Abbreviations; NT-proBNP, N-terminal pro–B-type Natriuretic Peptide; Hs-TnT, High-sensitivity Troponin T; CK-MB, Creatine Kinase–MB; L1, Level 1; L2, Level 2
Figures
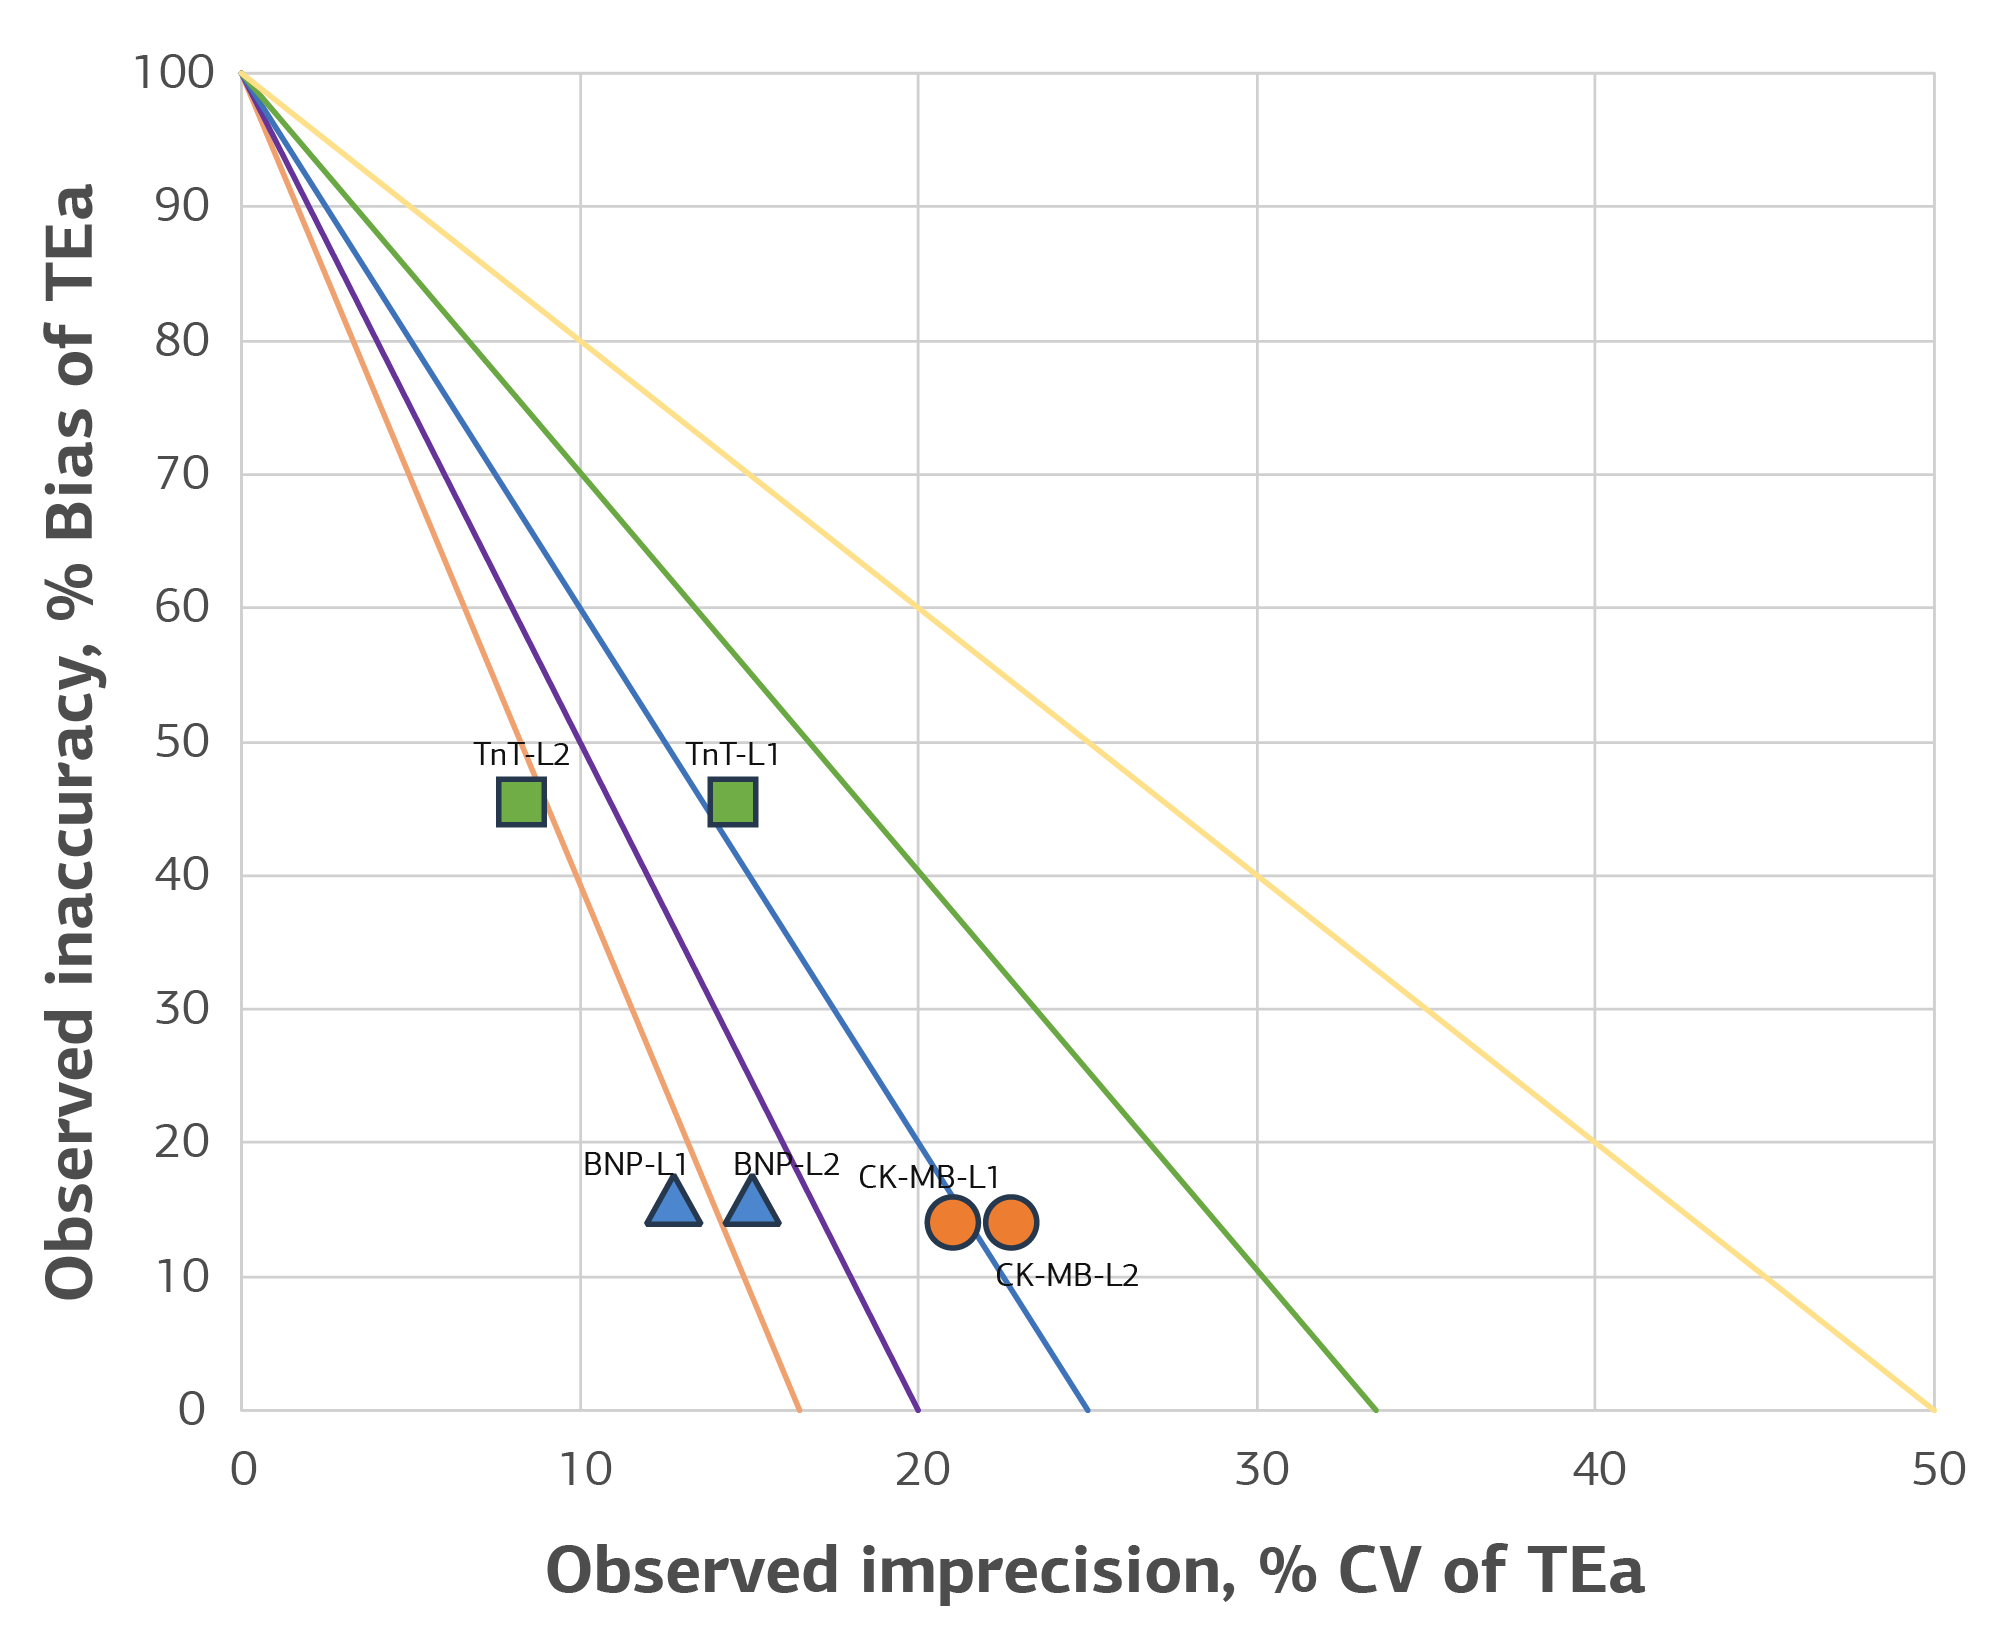
Figure 1. Normalized Operating Specifications Chart for Analyzer A, Showing 6 Months Average Sigma Values
Abbreviations: CV, Coefficient of variation; TEa, Total allowable error; BNP, N-terminal pro–B-type Natriuretic Peptide; TnT, High-sensitivity Troponin T; CK-MB, Creatine Kinase–MB; L1, Level 1; L2, Level 2. In the figure, the region enclosed by the orange line and the coordinate axes represents performance above the 6 sigma level. The area between the orange and purple lines corresponds to the 5–6 sigma range, the section between the purple and blue lines indicates 4–5 sigma, the space between the blue and green lines reflects the 3–4 sigma range, and the zone between the green and yellow lines represents the 2–3 sigma interval.
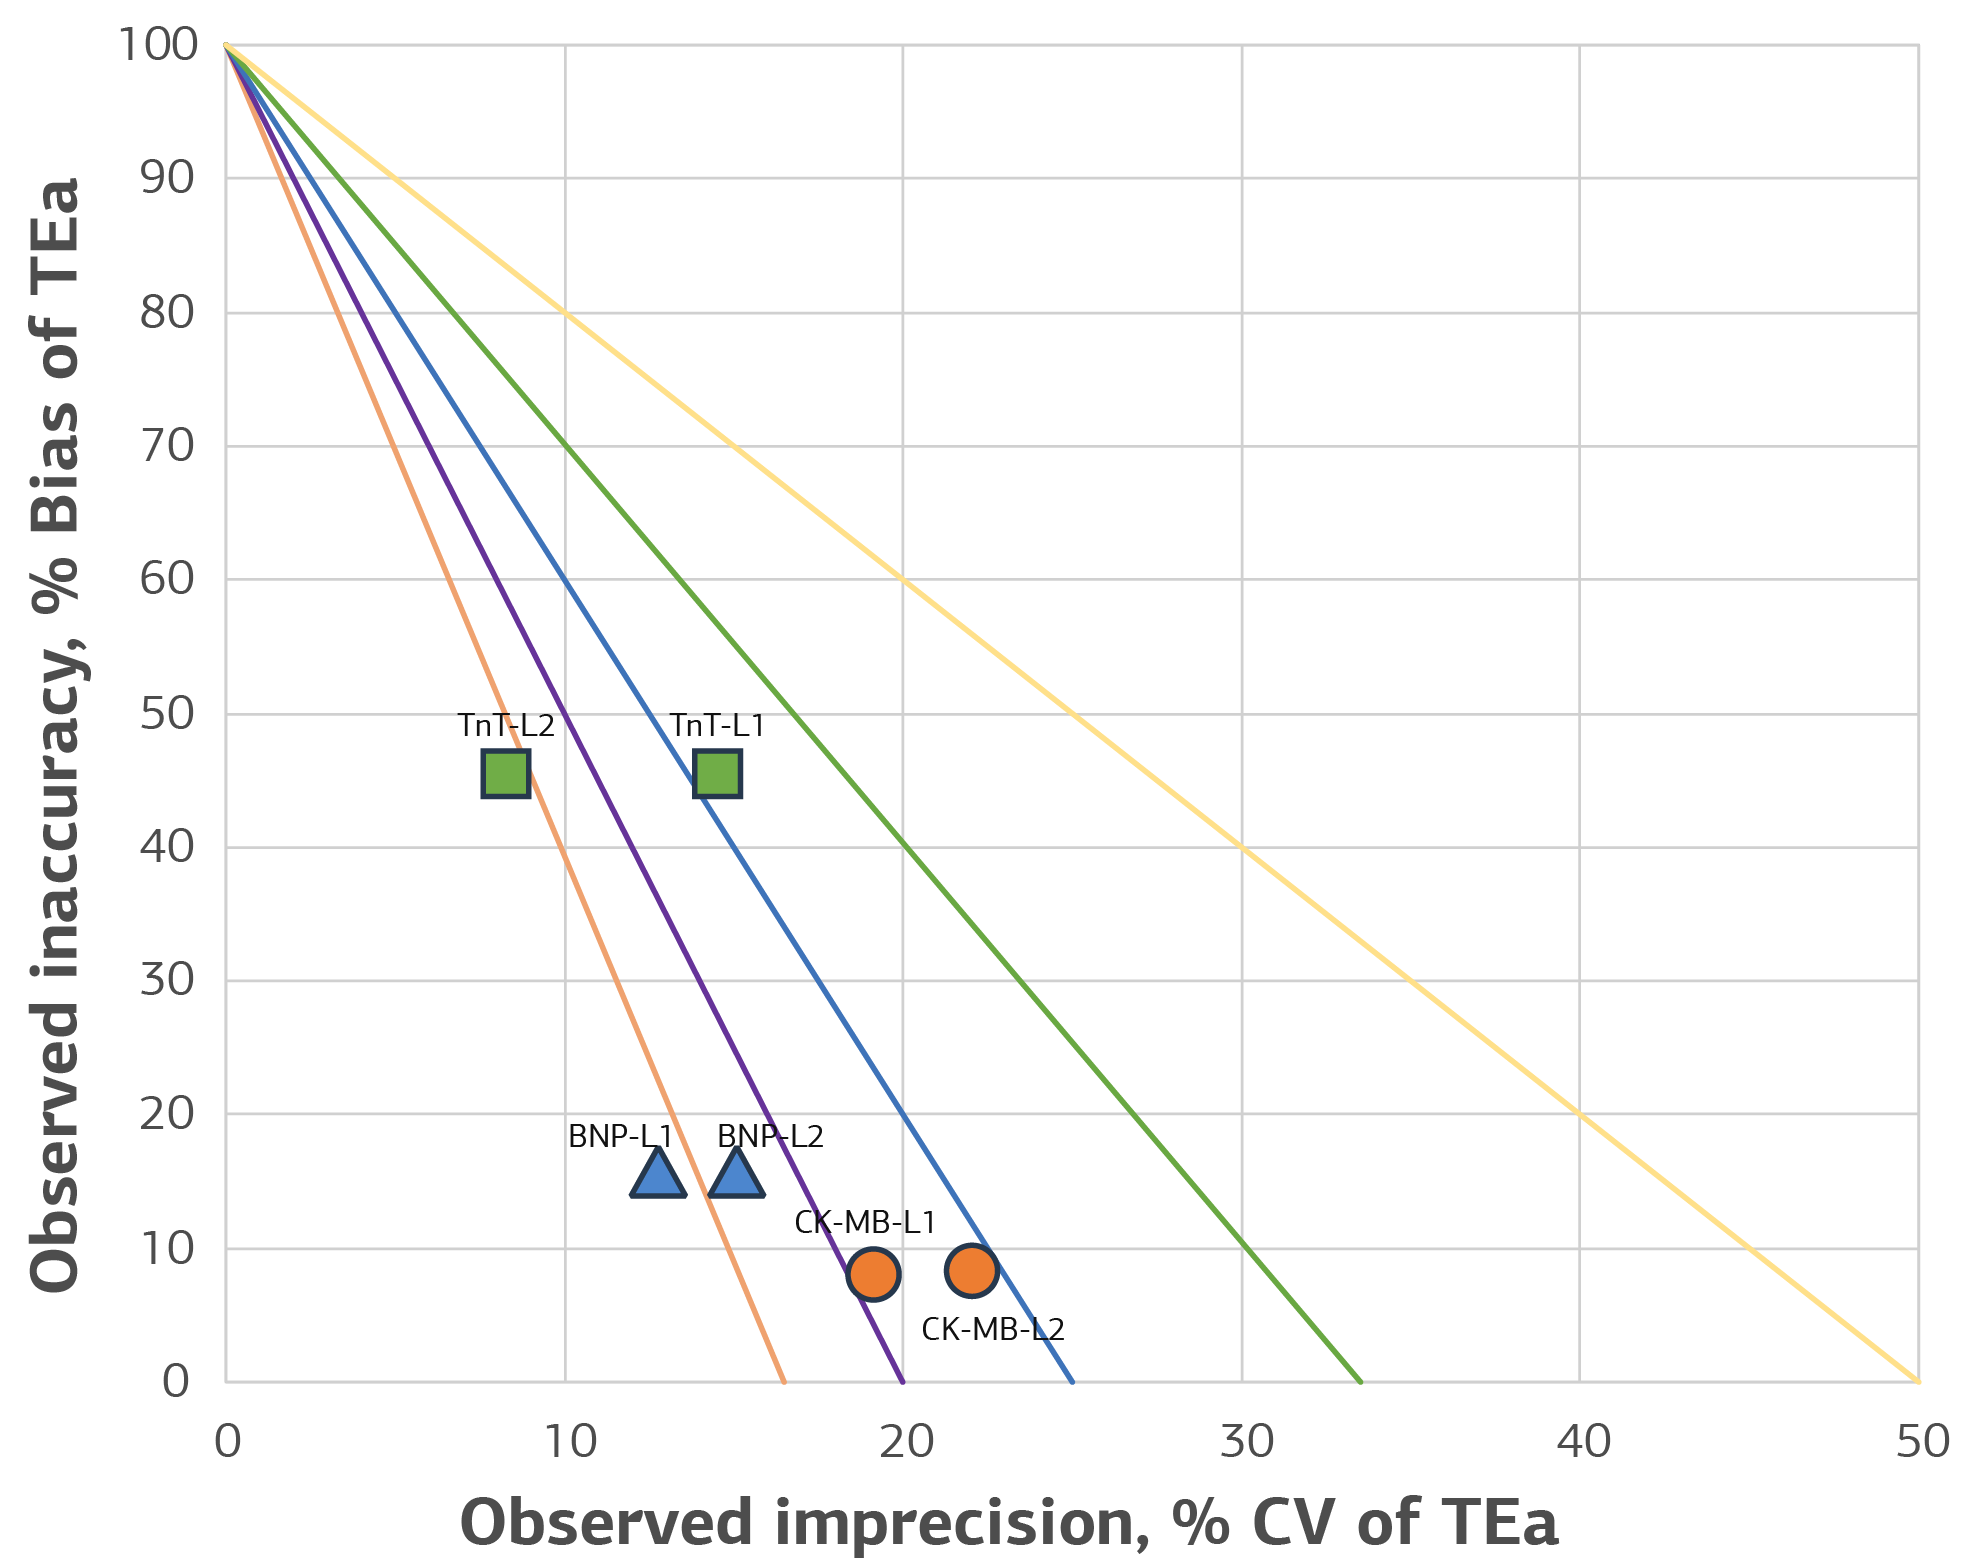
Figure 2. Normalized Operating Specifications Chart for Analyzer B, Showing 6 Months Average Sigma Values
Abbreviations: CV, Coefficient of variation; TEa, Total allowable error; BNP, N-terminal pro–B-type Natriuretic Peptide; TnT, High-sensitivity Troponin T; CK-MB, Creatine Kinase–MB; L1, Level 1; L2, Level 2. In the figure, the region enclosed by the orange line and the coordinate axes represents performance above the 6 sigma level. The area between the orange and purple lines corresponds to the 5–6 sigma range, the section between the purple and blue lines indicates 4–5 sigma, the space between the blue and green lines reflects the 3–4 sigma range, and the zone between the green and yellow lines represents the 2–3 sigma interval.
Additional Information
Publisher’s Note
Bayrakol MP remains neutral with regard to jurisdictional and institutional claims.
Rights and Permissions

This work is licensed under a Creative Commons Attribution-NonCommercial 4.0 International License (CC BY-NC 4.0). To view a copy of the license, visit https://creativecommons.org/licenses/by-nc/4.0/
About This Article
How to Cite This Article
Elif Bengu Gungor Ay, Fatma Ucar, Aziz Sener. Six Sigma-based assessment of critical cardiac biomarkers in the emergency laboratory. Ann Clin Anal Med. Articles in Press. doi:10.4328/ACAM.50032
Publication History
- Received:
- 14.01.2026
- Accepted:
- 31.03.2026
- Published Online:
- 01.04.2026
- Printed:
- 01.11.2026